Figure 3.
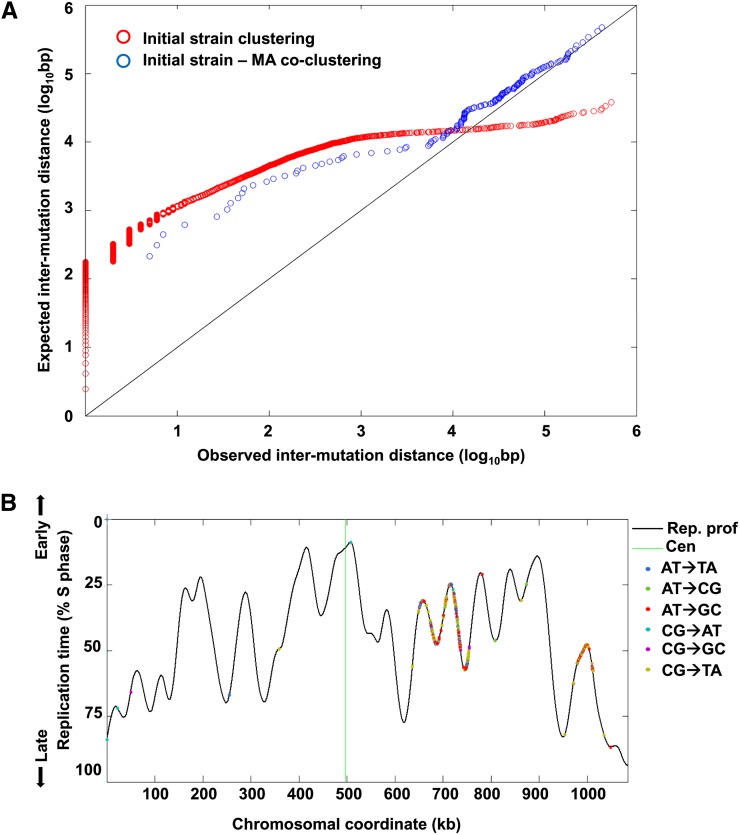
Mutation clustering in ∆8 cells. (A) Observed vs. expected distances between adjacent mutations. Observed distances are the distances between consecutive mutations on the same chromosome in the initial stain. To calculate the expected distances between mutations, we generated 100 sets of randomized genomic positions, each with the same number of loci as the number of mutations in the initial strain. We further calculated the distances between adjacent loci in each randomized set (as we did for the observed mutations) and averaged the distances across the 100 randomized iterations. Both observed and expected distances were sorted by increasing distance and plotted against each other (red circles). The diagonal represents equal expected and observed distances. As can be seen, most mutations were much closer to each other than expected by chance while mutational clusters were themselves very distant from other clusters, leading to the long tail of higher-than-expected intramutation distances. This indicates a very strong clustering of mutations along the genome. The distances between mutations in the MA lines and the nearest mutations in the initial strain were also calculated and compared to a set of 100 randomized genomic positions, each with the same number of loci as the number of mutations in the MA lines, as above. The observed vs. expected distances between MA line and initial strain mutations are shown in blue circles. Mutations in the MA lines tended to fall closer to initial strain mutation clusters than expected by chance. (B) An example of mutation clusters on chromosome VII of the original ∆8 strain. Shown is the DNA replication timing profile of the chromosome (black line; high values represent early replication, low values late replication; peaks correspond to replication origins and valleys to replication termini). The different mutation types are shown as dots along the replication profile. Two very tight mutation clusters can be observed (at ∼640–755 kb and at ∼980–1010 kb) with almost no mutations outside these two clusters. Similar plots for all chromosomes, with the locations of mutations in both the initial strain and the MA lines, are shown in Figure S2B.

