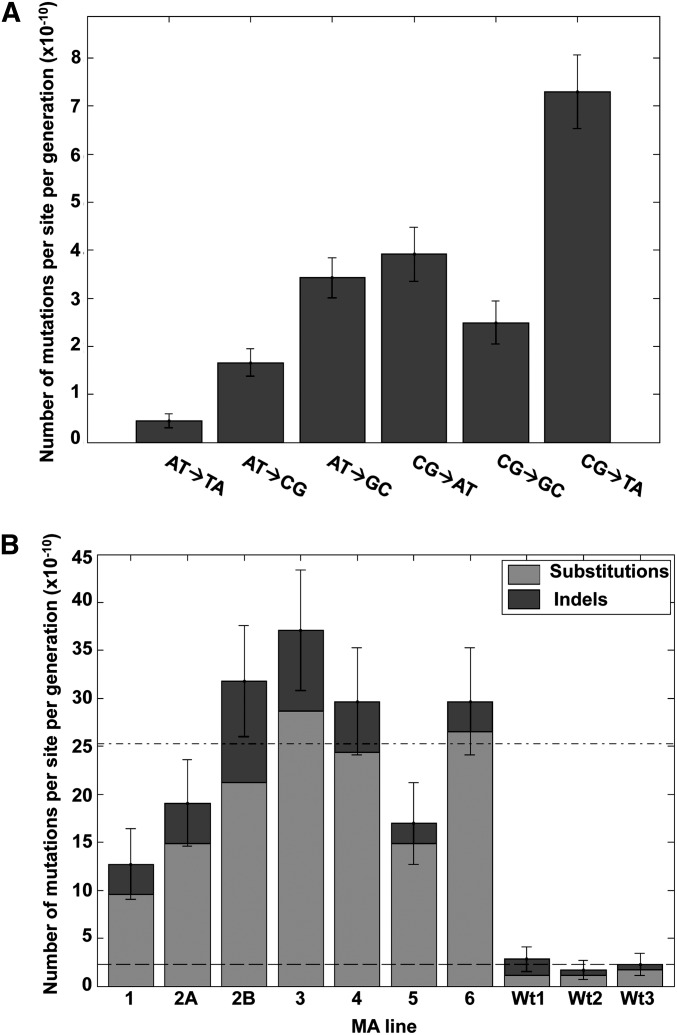
Figure 6.
Observed mutation rates for MA lines. (A) Observed total mutation rates per site/per generation after the long-term growth of MA lines. Shown is the average for all MA lines. (B) The mutation rate and standard error per MA line. Horizontal dashed lines are the average mutation rate (base substitutions and indels) for the ∆8 and the WT lines.

