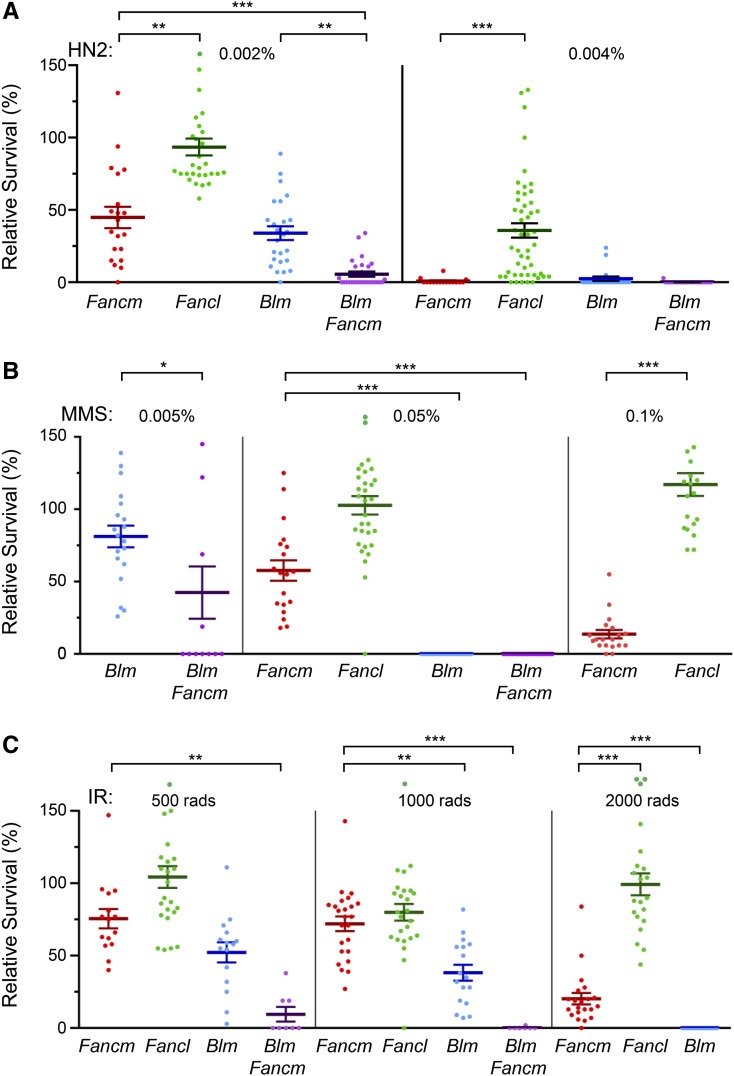
Figure 1.
Comparison of sensitivities of Fancm, Fancl, and Blm mutants. Plots show survival of the indicated mutants relative to control flies in the same vial after exposure to (A) the nitrogen mustard mechloramine (HN2), (B) MMS, or (C) IR. Survival of control flies did not appear to be reduced at the lower doses used here, but the highest doses reduced survival of control flies by ∼19% (HN2), 46% (MMS), and 53% (IR) (see Materials and Methods). Each dot represents one vial. Heavy bars are means; error bars are standard error of the mean. n = (left to right) HN2: 20, 30, 25, 28 | 16, 49, 20, 23; MMS: 26, 19 | 22, 32, 24, 28 | 19, 20; IR: 15, 25, 15, 8 | 24, 25, 17, 28 | 21, 21, 25. Statistical comparisons were done for Fancm compared to each other genotype, and Fancm Blm double mutants were compared to Blm single mutants: *P < 0.05; **P < 0.01, ***P < 0.001 (corrected for multiple comparisons; see Materials and Methods); all statistically significant comparisons are indicated. Seven of the 625 data points, all from Fancl vials, are off the scale and are not shown (values in parentheses): 0.002 HN2 (1.92), 0.05% MMS (1.97), 0.1% MMS (1.84, 1.84, and 1.80), and 500 rad IR (1.92 and 1.76).

