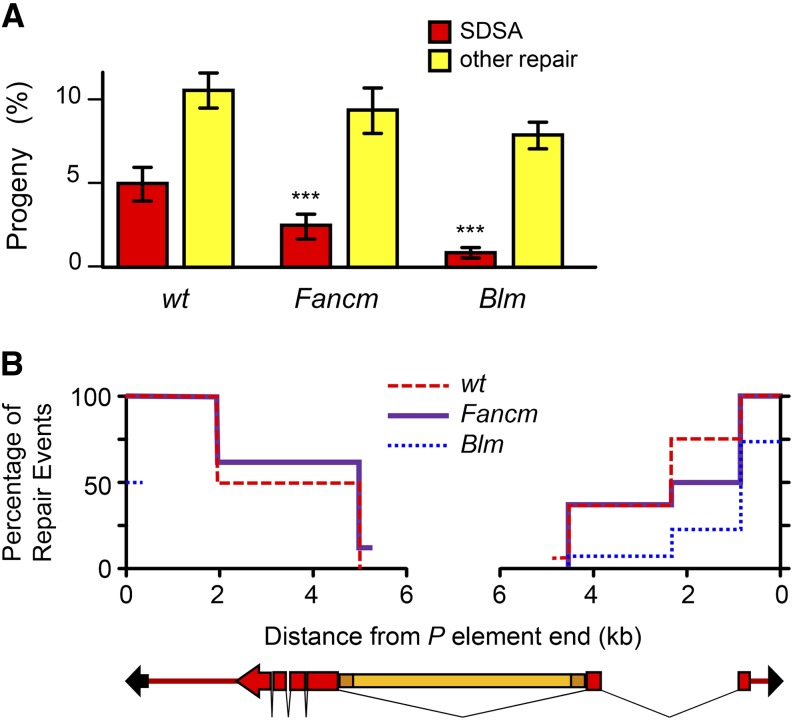
Figure 3.
SDSA defects in Fancm mutants. (A) Gap repair outcomes. Bars show mean fraction of flies in each repair class: red bars indicate repair by SDSA, and yellow bars indicate other types of repair (usually aborted SDSA followed by end joining). Of the remaining flies, most came from cells that did not experience an excision event, although a small percentage may also be from the repair of the entire gap by SDSA. Blm data are from McVey et al. (2007). Error bars are standard error of the mean. n = 85 for Fancm and 45 for control. ***P < 0.001 compared to wild type. (B) Kaplan–Meier graph showing the amount of synthesis from each end of the P element in non-SDSA progeny (those with yellow eyes). PCR was done on sons of these progeny to detect synthesis from the left end at 5 bp, 1.7 kb, and 5.2 kb from the cut site and from the right end at 5 bp, 920 bp, 2.4 kb, and 4.6 kb from the cut site. Blm data are from Adams et al. (2003); the left end was analyzed only at 5 bp in that study. The drawing at the bottom represents the P{wa} element: black arrows, P-element ends; red, white gene (boxes, exons; lines, introns); orange, copia element (dark, long terminal repeats). n = 16 (Fancm), 83 (wild type), and 147 (Blm).

