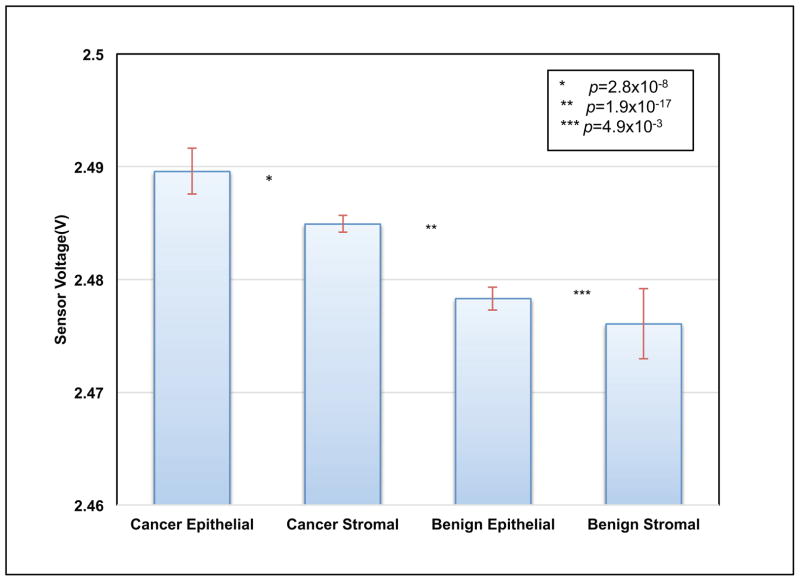
Fig. 6.
Reproducibility of result for un-paired tissues. Voltage values for each piezoresistive responses curve were extracted at 20 μm and aggregated by group as shown. The red bar shows within-group standard deviations. The t-test found high significance between each adjacent group (p values as shown).

