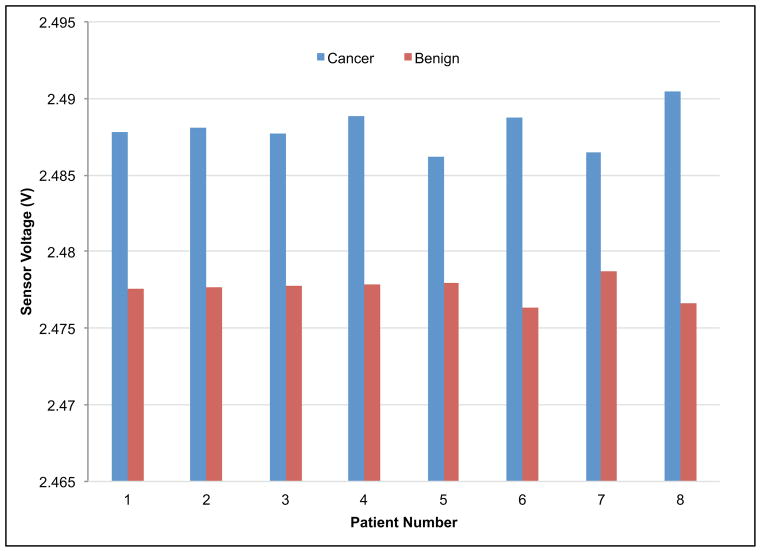
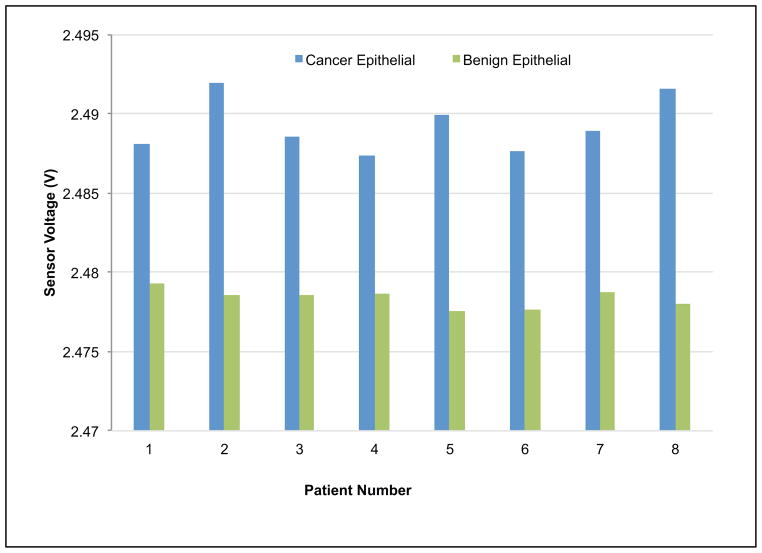
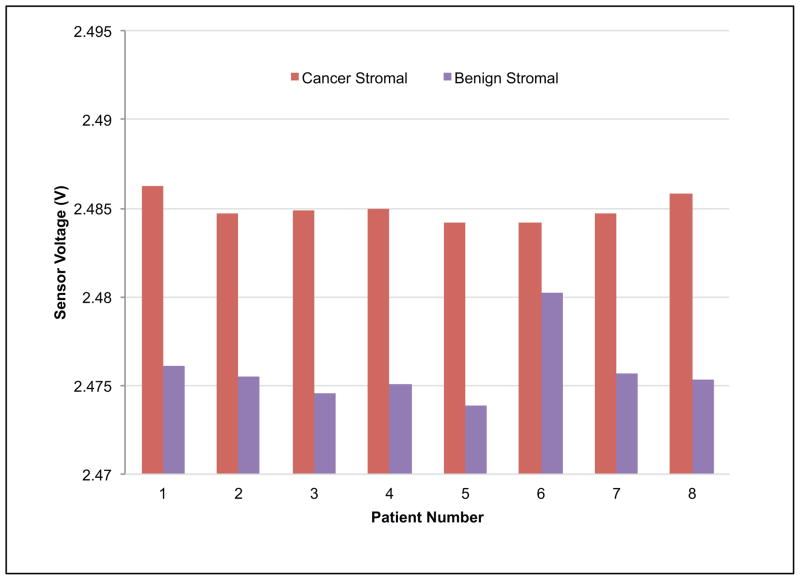
Fig. 7.
Indentation results for paired tissues samples. Voltage values for each piezoresistive responses curve were extracted at 20 μm and aggregated by group (a) benign versus cancer, (b) benign epithelial versus cancer epithelial, and (c) benign stromal versus cancer stromal. The t-test found high significance between cancer/benign specimens, cancer/benign epithelial, and cancer/benign stromal.


