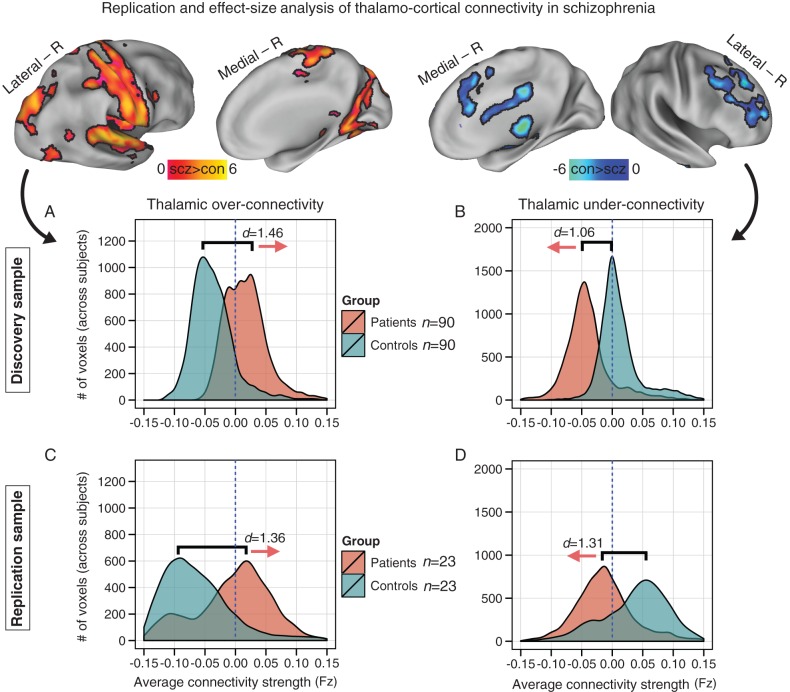
Figure 2.
Replication and effect-size analysis of thalamo-cortical connectivity in schizophrenia. Top panels show increased (left) versus reduced (right) thalamic coupling in schizophrenia. Distributions of average connection strengths for each voxel showing (A) increased and (B) reduced thalamic coupling in schizophrenia. (C and D) Independently diagnosed replication sample. Effect sizes (Cohen's d) indicate robust effects across samples. Blue vertical dashed lines mark the zero point, highlighting increased thalamic coupling with sensory–motor networks and decreased coupling with prefrontal–striatal and cerebellar regions for patients. Supplementary Figure 3 shows distributions for the bipolar sample; Supplementary Figure 4 shows schizophrenia versus bipolar contrast maps.

