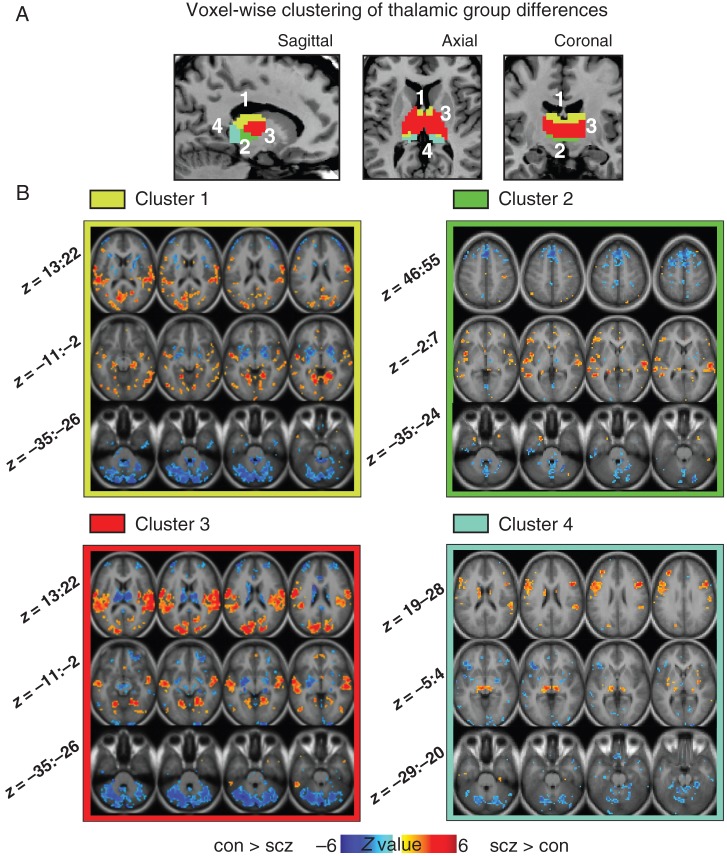
Figure 4.
Voxel-wise clustering of group differences in thalamic connectivity. (A) Results of 4-cluster solution identifying thalamic voxels with similar patterns of whole-brain connectivity differences between groups (see Supplementary Fig. 8 for workflow and Supplementary Fig. 9 for a 6-cluster solution). (B) Between-group difference maps when a given cluster is used as a seed. The pattern of between-group differences for cluster 3 (red) was qualitatively most similar to main effects (see Fig. 1), which roughly corresponds to higher-order associative thalamic nodes (Behrens et al. 2003). Z-coordinates as in Figure 1.

