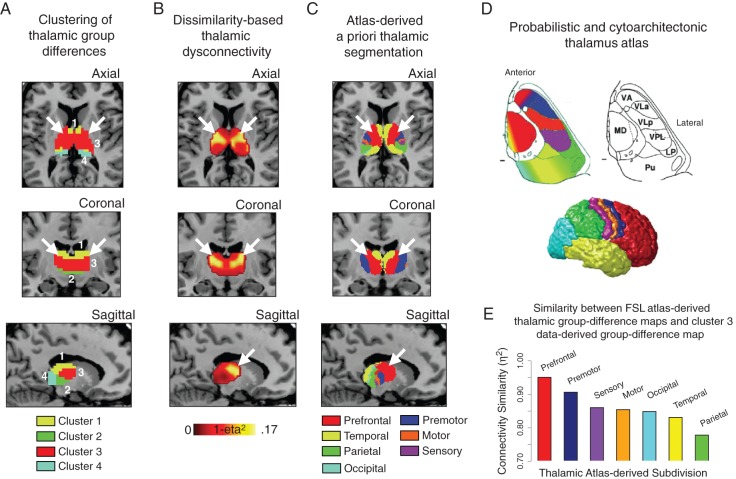
Figure 5.
Intrinsic thalamic dysconnectivity in schizophrenia. (A) Results of 4-cluster solution identifying thalamic voxels with similar patterns of whole-brain connectivity differences between groups (as in Fig. 4). (B) Intrinsic thalamic dysconnectivity pattern based on group dissimilarity (1 − η2) (Jenkinson et al. 2012). Brightest voxels are associated with highest between-group differences. (C) Thalamus subdivisions based on the FSL thalamic atlas, to facilitate the comparison of data-driven dysconnectivity relative to the anatomy. White arrows show the correspondence across results for thalamic nodes with strong PFC connectivity. (D) Adapted with permission (Smith and Nichols 2009), to allow inspection of thalamic segmentation in comparison to between-group findings: (top-left), thalamic nuclei color-coded based on the major cortical connection site, (top-right) cytoarchitectonic atlas subdivisions (Saad et al. 2012), and (bottom) cortical sectors showing different patterns of thalamic anatomical connectivity. (E) Quantitative comparison of similarity (η2) between each anatomically based between-group differences map and cluster 3 from panel A. We used an FSL-based atlas-derived seeds across thalamic nuclei (independent of this sample altogether) to compute a group difference map. We then quantified how similar each atlas-derived seed result was to those identified from the medio-dorsal cluster in our data (to be distinguished from any anatomy-based analyses that are defined based on subject-specific data in the current sample). For all atlas-derived maps of between-group differences see Supplementary Figure 10; for similarity matrix comparing 4- and 6-cluster solutions relative to independent atlas-derived subdivisions see Supplementary Figure 11.

