Figure 6.
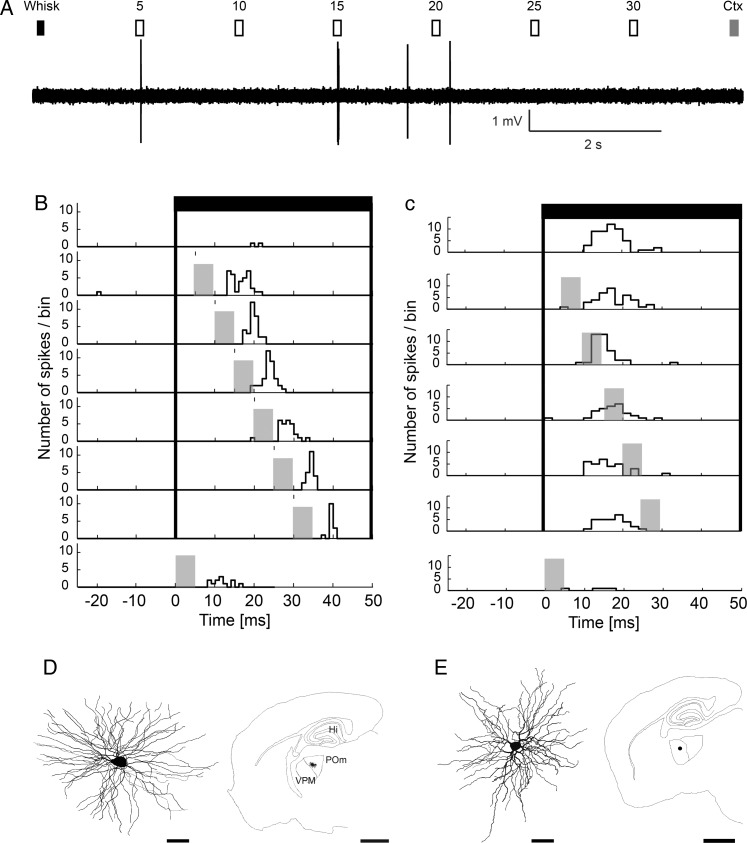
Thalamic integration of cortical and brainstem drivers in POm but not in VPM. (A) Stimulation protocol and recording of a mouse POm driver integrator neuron in response to sensory stimulation (Whisk, black rectangle), cortical stimulation (Ctx, gray rectangle), or paired stimuli (open rectangles) with different delays (5–30 ms). Individual trials began with a whisker deflection alone and were followed by combined whisker and BC stimulations with different delays as indicated. Trials ended with BC laser stimulation. (B) Peristimulus time histogram (PSTH) for each stimulus condition in a POm cell. Whisker stimulation, black bars (t = 0 ms); BC stimulation, gray bars (t = 5–30 ms). Note low response magnitude to whisker alone (top row) and cortex alone (bottom row) conditions and a prominent increase of firing rate with paired stimulation (6 middle rows) with different delays. (C) VPM neuron responded well to whisker deflection (black bars) but this response was not enhanced with additional BC stimulation (gray bars). (D) Neurolucida reconstruction (left) and position (right) of a POm neuron displaying driver integration in a parasagittal section. (E) Neurolucida reconstruction (left) and position (right) of the VPM neuron in a parasagittal section. The activity of the cell is shown in C. Note the different size of the scale bars. Scale bar, cells: 20 μm; slice outline: 1 mm.

