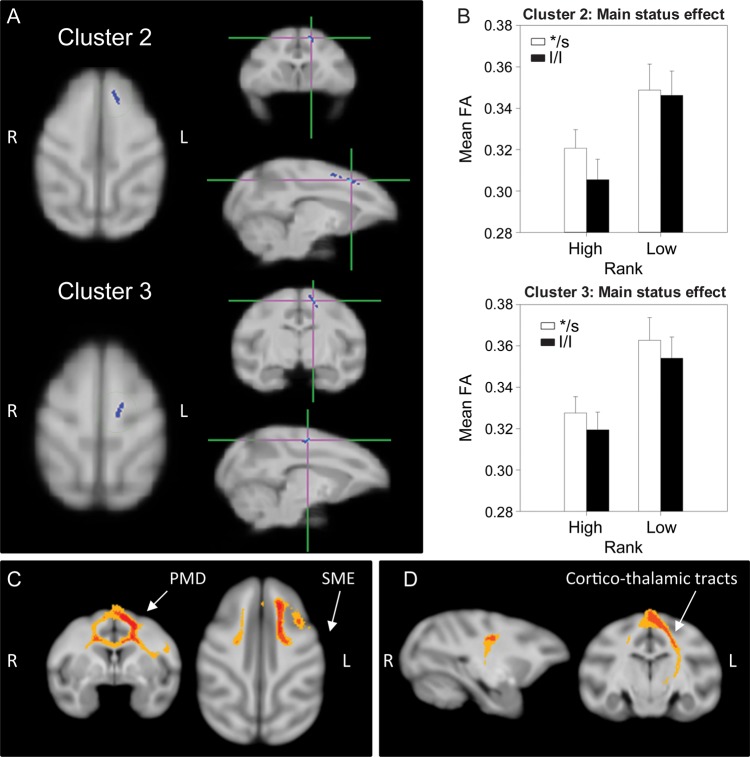
Figure 2.
Results of the DTI analysis: Main effect of status. (A) TBSS 2 × 2 ANOVA results showing the main effect of status in 2 clusters, 2 and 3: WM along the left dorsal medial wall. (B) Results from the 2-way ANOVA showing that low-ranking animals have significantly higher FA than high-ranking ones. (C and D) Probabilistic tractography: Group probability map (subject-level threshold at 1% of the robust mean intensity with distance correction applied) showing that (C) both clusters of significant voxels in (A) involved short-range, cortico-cortical fibers (intra- and interhemispheric) in the dorsomedial wall, interconnecting frontal regions corresponding to the primary and supplementary motor area (SMA) and premotor cortex in most of the animals, as well as connections of these frontal motor areas with somatosensory cortex (SSC) in about 25–50% of subjects. Left-to-right images represent coronal and axial planes. The composite images (group probability maps) show voxels that were common to at least 15 (40%) animals. Colors represent the percentage of subjects that showed connectivity with that voxel in the single-subject analysis: 40–60% animals in yellow, 60–80% in orange, and 80–100% in red. PMD: dorsal premotor cortex; SME: somatosensory cortex (D) represents the group probability map of additional caudal tractography in cluster 3, suggesting the involvement of cortico-thalamic tracts connecting somatosensory and primary motor cortices with thalamic regions. Left-to-right images represent sagittal and coronal planes. Thresholds and color codes as in C.

