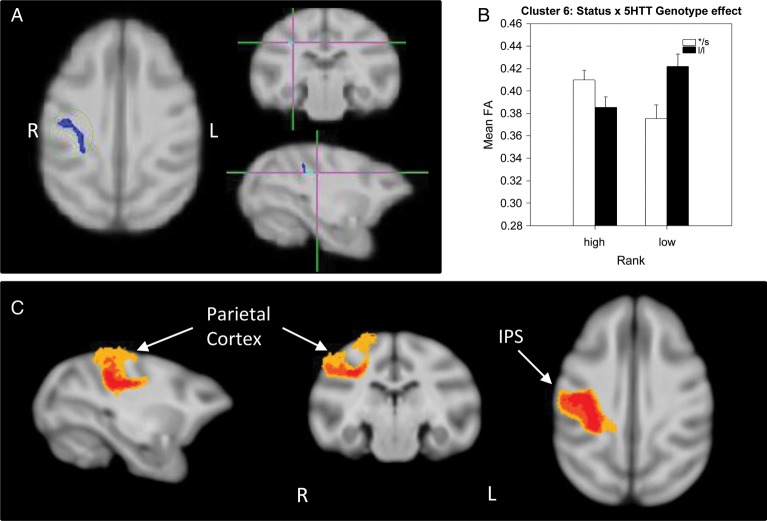
Figure 5.
Results of the DTI analysis: Status × 5HTT genotype interaction effect. (A) TBSS 2 × 2 ANOVA results showing a status × genotype interaction in a cluster (cluster 6) in the right parietal WM. (B) Results from the 2-way ANOVA showing that dominant l/l animals had lower FA than s-variant ones, and l/l subordinates had higher FA than low */s. (C) Probabilistic tractography: Group probability map (subject-level threshold at 1% of the robust mean intensity with distance correction applied) showing that the cluster of significant voxels in (A) corresponds to short-range, parietal cortico-cortical “U” fibers in the right hemisphere. Left-to-right images represent sagittal, coronal, and axial planes. The composite images (group probability maps) show voxels that were common to at least 15 (40%) animals. Colors represent the percentage of subjects that showed connectivity with that voxel in the single-subject analysis: 40–60% animals in yellow, 60–80% in orange, and 80–100% in red. ips: intraparietal sulcus.

