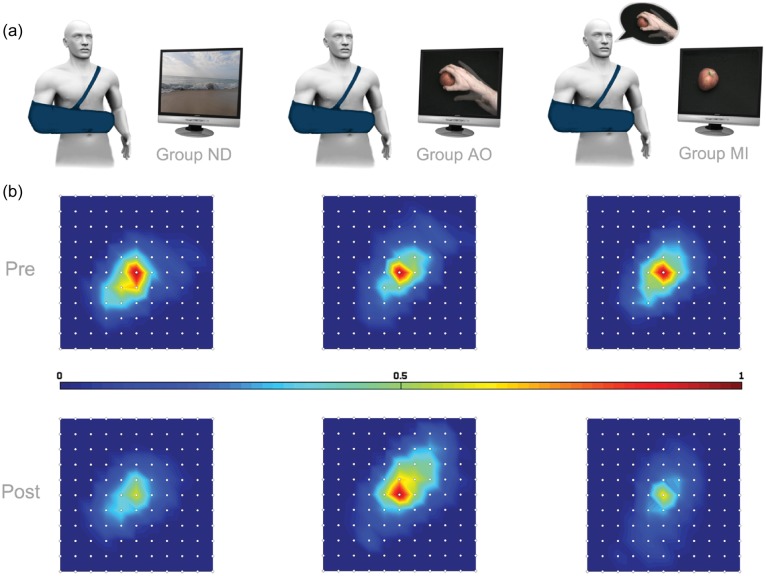
Figure 1.
Mean FDI corticomotor maps recorded before (Pre) and after (Post) immobilization in the 3 groups. (a) In ND (on the left), AO (in the middle), and MI (on the right) groups, participants performed the requested task for 10 hourly sessions during the immobilization period (from around 8 AM to 6 PM). (b) Each map was centered on the maximal response obtained for each participant in every condition, regardless of antero-posterior (here corresponding to above–below directions) and medio-lateral (here right-left) coordinates. Colors indicate the amplitude of MEP, normalized with respect to the maximal response obtained in the Pre-condition in every subject, from “blue” (the lowest values) to “red” (the highest responses).

