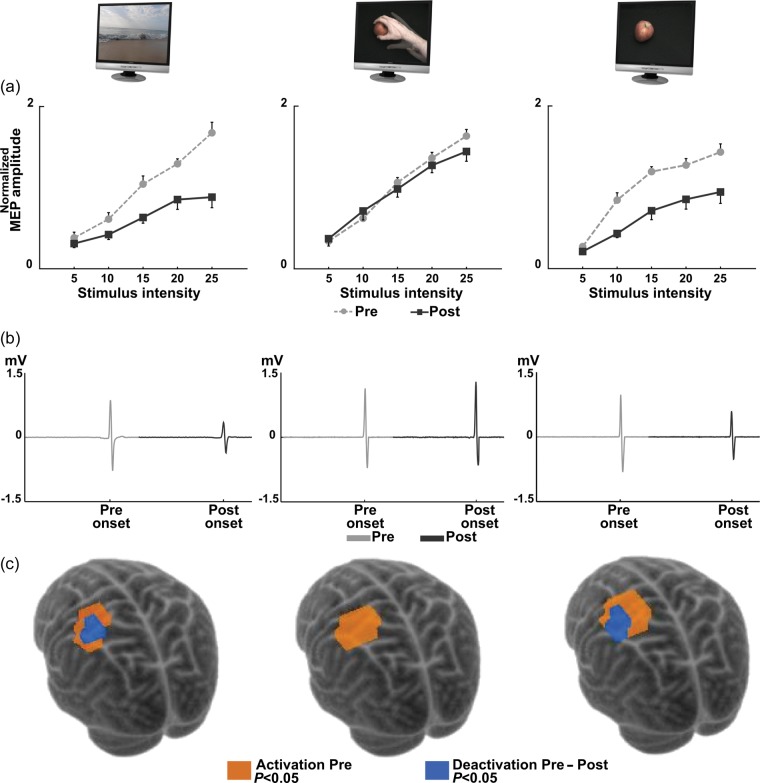
Figure 2.
Effect of AO in preventing corticomotor modifications induced by immobilization. (a) MEP RCs of right FDI in ND, AO, and MI before (dashed light line, Pre) and after (solid dark line, Post) immobilization. On the abscissa, TMS stimulus intensity above RMT (% of MSO); on the ordinate, mean values of the normalized MEP ± standard error. A significant Pre–Post difference is present in ND and MI, but not in AO. (b) A typical MEP from one scalp site of one exemplificative subject from each group averaged among the repeated recordings before (light gray) and after (dark gray) immobilization. Two-dimensional image time series were filled with these data from all scalp sites. (c) Scalp sites significantly responding to TMS before immobilization (orange, P < 0.05) and significantly deactivated after nonuse (blue, P < 0.05, Pre - Post) are shown (overlaid onto a 3D rendering of the Montreal Neurological Institute, MNI, template brain by coregistering FDI cortical coordinates onto the MNI space, Niyazov et al. 2005). In ND and MI was evident a significant deactivated area (blue) that was completely absent in AO.

