Fig. 2.

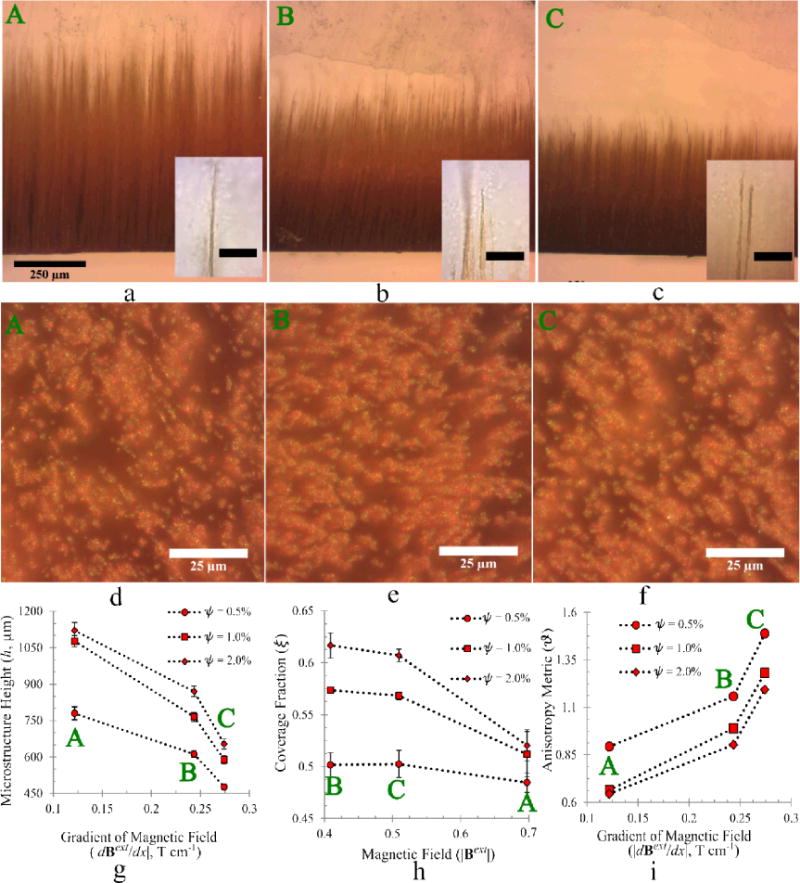
(a–c) Optical micrographs of self-assembled structure profiles for three different conditions labeled A, B and C in Table 1 for an MNP mass concentration ψ = 0.5%. Insets are high magnification images of the corresponding tips. The scale bar in the insets are 25μm. (d–f) Optical micrographs of the substrate in the dispersion, showing the base of the filamentous microstructure. (g) The height of the microstructure decreases monotonically with |dBext / dx| whereas (h) the fraction of the substrate covered by nanoparticles decreases monotonically with |Bext|. (i) The anisotropy metric ϑ determined from this data increase monotonically with |dBext / dx|, which we predict through a scaling law applicable for the experimental conditions (Supplement 3).
