
Figure 5.
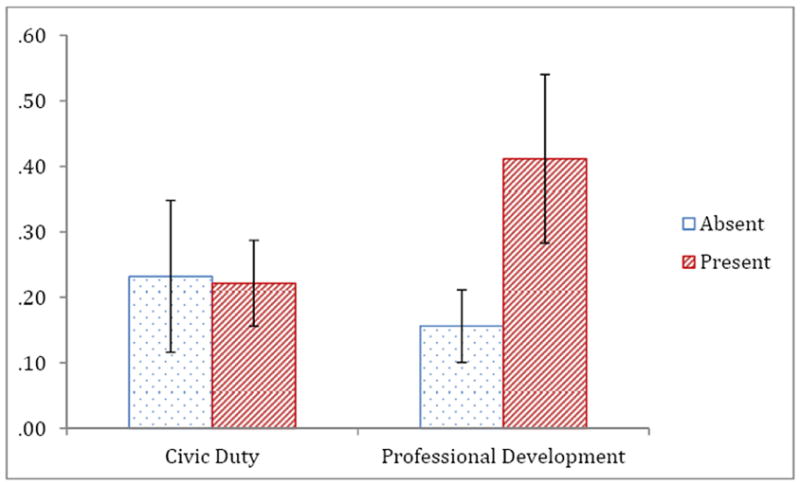
graphs moderation of overall effects by two possible motivations of mentors, civic duty and professional development.
Plots of average overall standardized mean difference (SMD) effect sizes and 95% confidence intervals by levels of moderating variables.