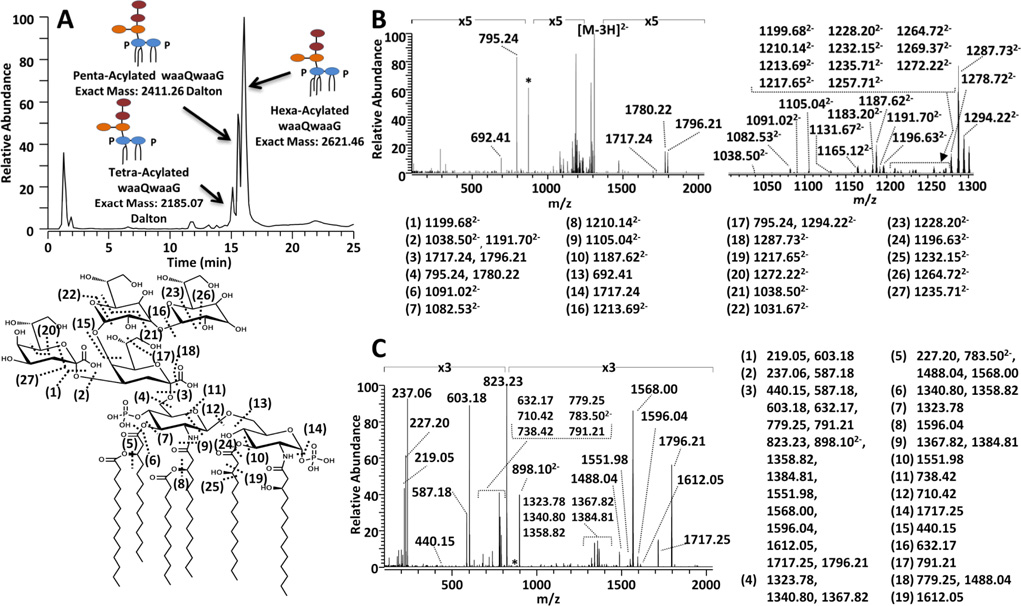
Figure 4.
LC-UVPD-MS analysis of lipooligosaccharides from E.coli BN1 ΔwaaQwaaG culture. A) LC-MS trace (top left) of a mixture of LOS from E. coli BN1 ΔwaaQwaaG culture, B) UVPD mass spectrum (top right) and C) UVPD/HCD mass spectrum (lower right) of a hexa-acylated BN1 ΔwaaQwaaG LOS (z = 3−) [Mr = 2621.46]. The zoomed-in region between m/z 1000 and 1300 of the UVPD spectrum is shown on the top right. The fragmentation map of hexa-acylated waaQwaaG LOS is shown the bottom left and the corresponding fragment ions associated with each mass spectrum are shown adjacent to each spectrum.

