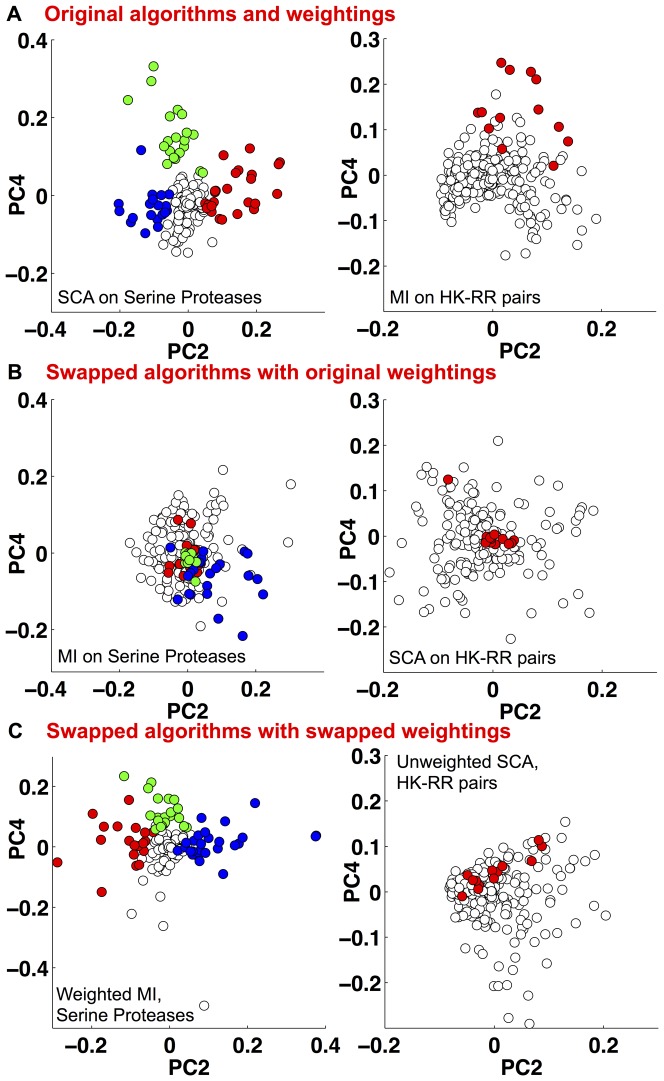
Figure 1. A) PCA of (left) the correlation matrix produced by SCA v3.0 applied to the serine protease alignment and (right) the correlation matrix produced by MI applied to the histidine kinase - response regulator (HK-RR) alignment (see methods).
These plots largely recover the experimentally verified residues (red, green and blue) that control the different phenotypes identified in [8] and [7] respectively. B) (Left) Applying MI to the serine protease alignment does not recover the functionally relevant residues, colored as (A), they mostly cluster around the origin. (Right) Applying SCA to the HK-RR sequence alignment also does not recover the relevant residues. C) (Left) Applying MI combined with the SCA weighting function to the serine protease alignment recovers the relevant residues, compare with A. (Right) Application of unweighted-SCA to the HK-RR alignment improves performance at detecting the relevant residues.

