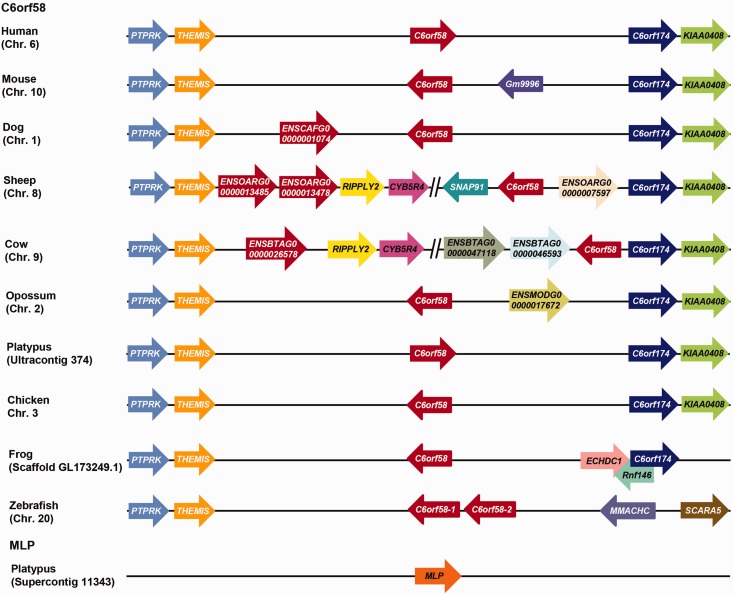
Fig. 10.—
Comparison of platypus MLP and C6orf58 gene synteny from various vertebrate species. Schematic representation of chromosomal regions containing platypus and other vertebrate C6orf58 flanking genes. Arrows indicate the arrangement and orientation of genes. Gene sizes and intergenic distances are not drawn to scale.

