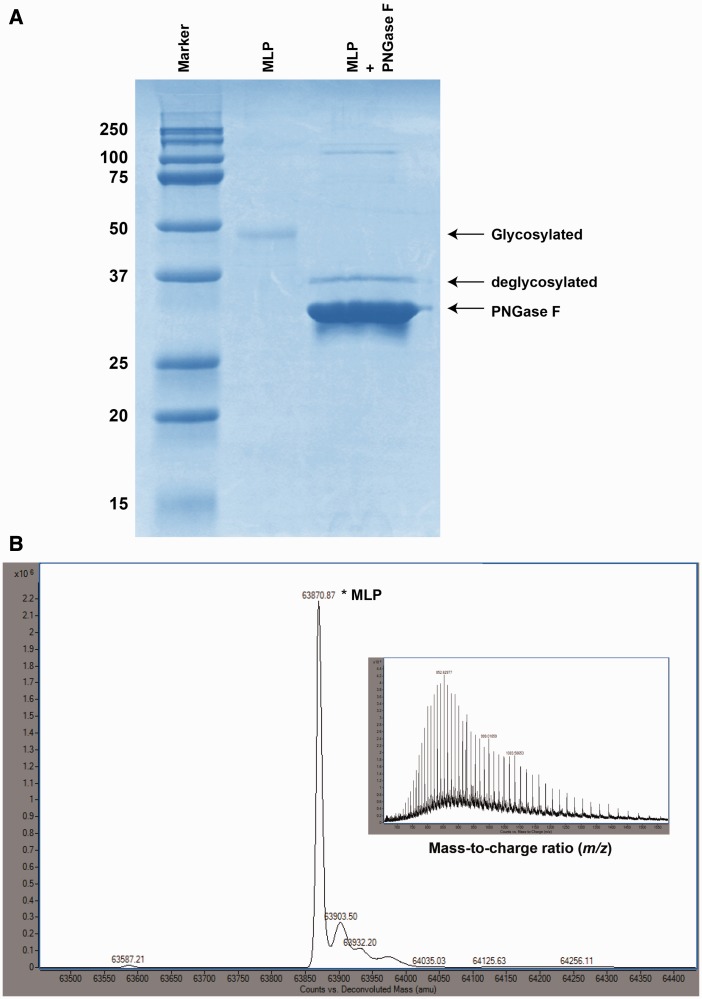
Fig. 7.—
Analysis of the N-linked glycosylation of MLP. (A) The SDS-PAGE shows the difference in protein migration due to N-linked glycosylation of recombinant MLP (∼49 kDa), as compared with the deglycosylated MLP (38.4 kDa). Lane 1, molecular weight marker; lane 2, purified MLP (untreated); lane 3, purified MLP treated with PNGase F (deglycosylated). Enzymatic deglycosylation converted MLP into a single faster migrating band. (B) Deconvoluted ESI-TOF mass spectrum of glycosylated MLP, with the mass of the highest peak (63,870.87 Da) corresponding to the relative molecular weight of MLP, indicating that heavy glycosylation of protein. Inset: Raw mass-to-charge spectrum of MLP. Raw MS data plotted as intensity versus mass-to-charge ratio.

