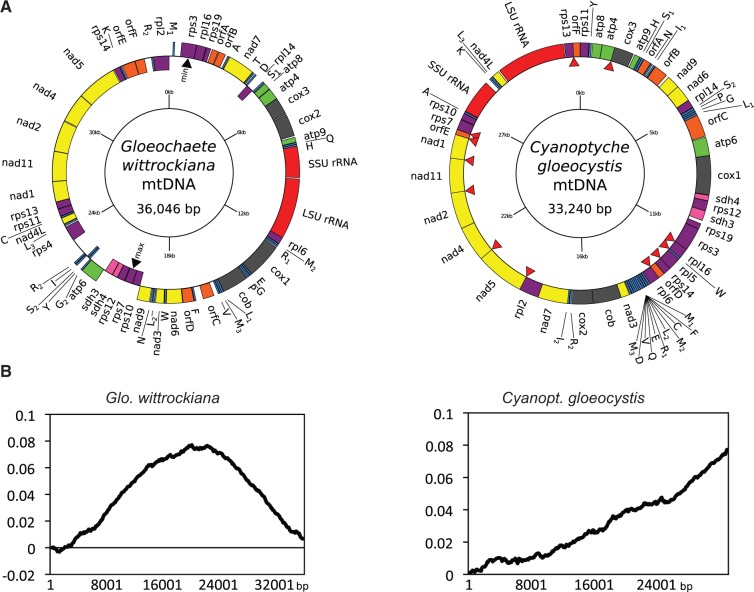
Fig. 1.—
Gloeochaete wittrockiana and Cyanoptyche gloeocystis mtDNAs and cumulative GC-skew plots. (A) Circular gene maps of Glo. wittrockiana (strain SAG 46.84) and Cyanopt. gloeocystis (strain SAG 4.97) mitochondrial genomes. Colored bars identify types of genes/ORFs: rRNAs (red), tRNA (blue), ribosomal proteins (purple), complex I (yellow), complex II (pink), complex III and IV (dark gray), complex V (green), uORFs (orange). Red arrowheads indicate overlaps between genes. (B) Cumulative GC-skew plots for Glo. wittrockiana and Cyanopt. gloeocystis mtDNAs. y axis: cumulative GC skew, x axis: position in the genome.

