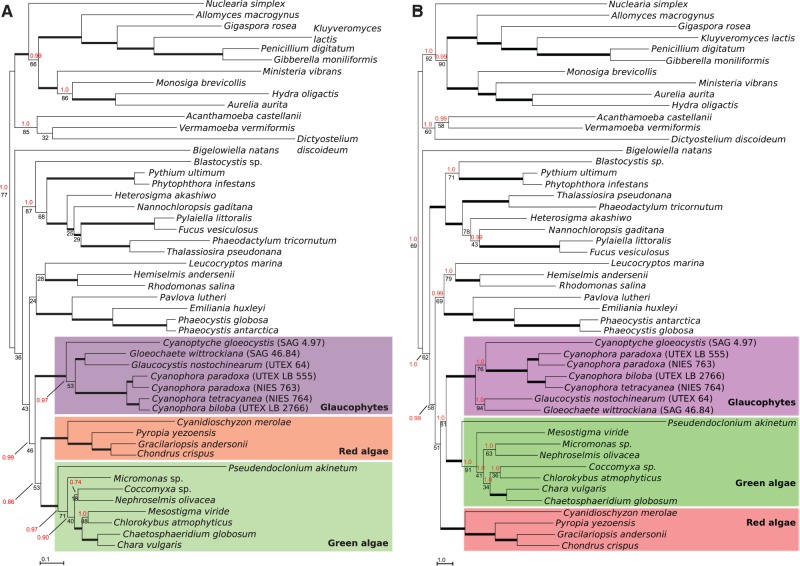
Fig. 4.—
Phylogenetic analysis of 14 mitochondrial genes. ML phylogenetic tree estimated from conceptual translations (A) and nucleotide sequences (B) of atp6, atp9, cob, cox1, cox2, cox3, nad1, nad2, nad3, nad4, nad4L, nad5, nad6, and nad7. Numbers above and below branches represent Bayesian PP and RAxML BS proportions, respectively. Thick branches are supported by PP and BS values greater than 95. Branches without PP values were only recovered in the ML analysis. Branch lengths are proportional to the number of substitutions per site.

