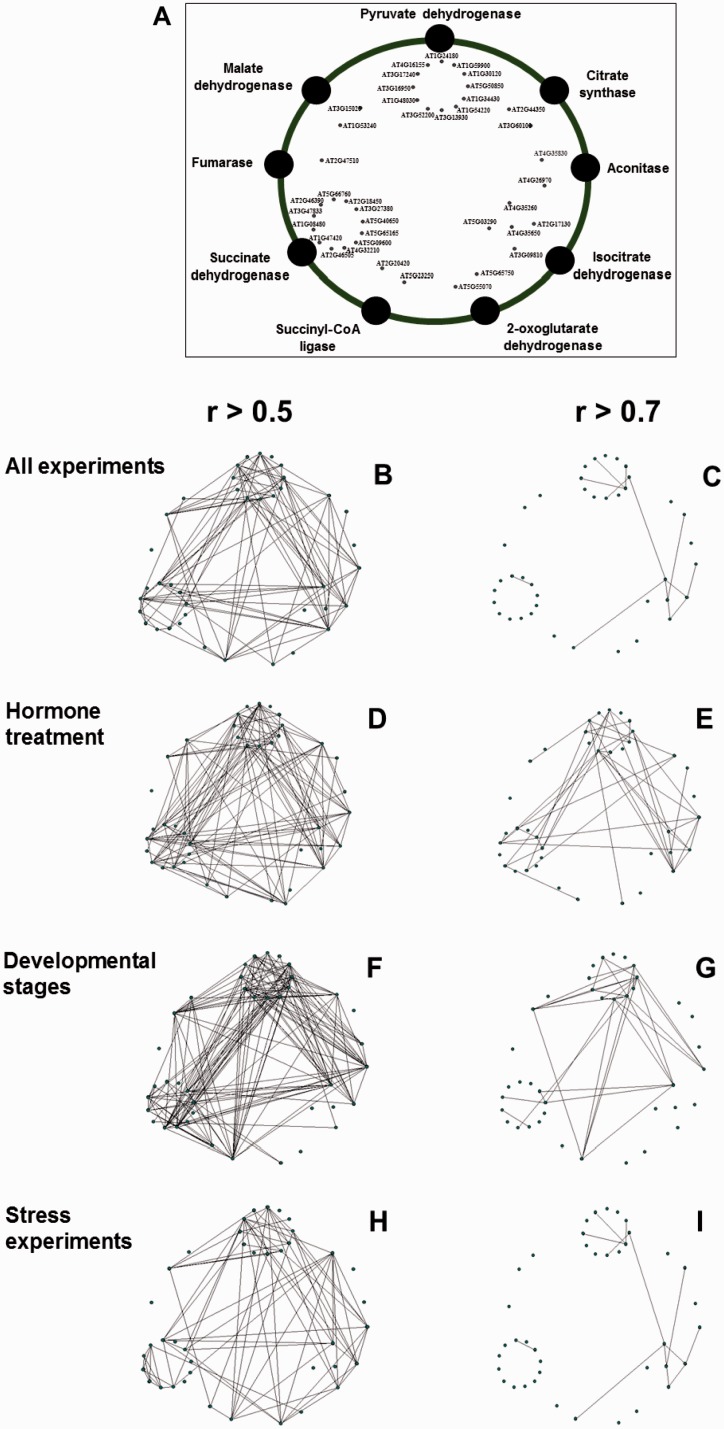
Fig. 5.—
Coexpression analysis using mitochondrial genes of the TCA cycle from plant. (A) Framework for coregulation network analysis of mitochondrial isoforms of TCA cycle-related genes using the Pajek software. Transcriptional data mining was performed using coexpression PRIMe database (http://prime.psc.riken.jp/?action=coexpression_index, last accessed October 13, 2014) using as trap the genes listed in supplementary table S1, Supplementary Material online. Coresponse connection was performed using coefficient values calculated by a microarray data set of all experiments covering 1,388 microarray data (B and C); “hormone treatment” covering 326 data (D and E), “developmental stages” covering 237 data (F and G), and “stress experiments” covering 298 data (H and I). Analyses were performed with cut-off value of r > 0.5 for (B), (D), (F), and (H) and of r > 0.7 for (C), (E), (G), and (I). Connections between each genes were prepared by “intersection of sets “search. The output files which were formatted with “.net” file from PRIMe database were later used to drawn the networks using Pajek software (Batagelj and Mrvar et al. 1998). Abbreviations and locus names of genes used are available in supplementary table S1, Supplementary Material online.

