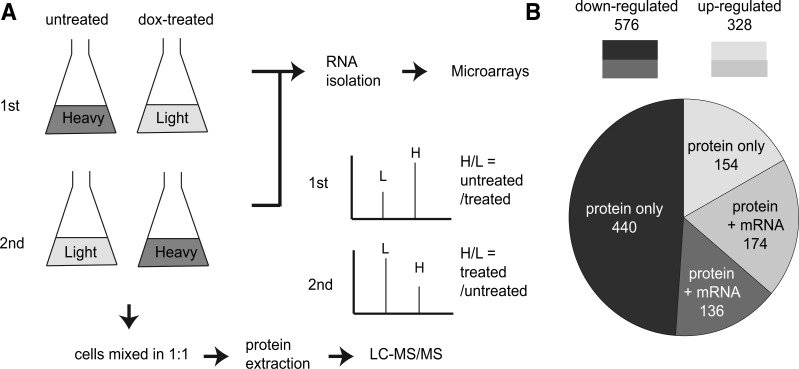
Fig. 1.—
Overview of SILAC methodology and results. (A) Flow chart of the SILAC and microarray experiments. Cells were first grown in heavy or light amino acid-containing media. Before RNA and protein extraction, the experimental sets of cultures were treated with 5 μg/ml dox for 11 h to reduce the Hsp90 level. The culture was then split into two parts out of which one was used for RNA isolation. The RNA was processed to cDNA and subjected to microarray analyses. The remaining heavy- and light-labeled cells were combined in a 1:1 ratio of cell numbers and the total protein was extracted. The extracted total protein was in-solution digested and subjected to LC-MS/MS. The mass spectrum for the same peptide had paired signals (H vs. L) due to heavy isotope incorporation. Changes in the protein abundance upon dox treatments were inferred from the H/L ratio. (B) Hsp90 maintained protein abundance mainly through posttranscriptional regulation. “Protein only” denotes the ORFs that showed changes in protein abundance but not in the mRNA levels. “Protein + mRNA” denotes the ORFs that showed changes in both the protein and mRNA levels.

