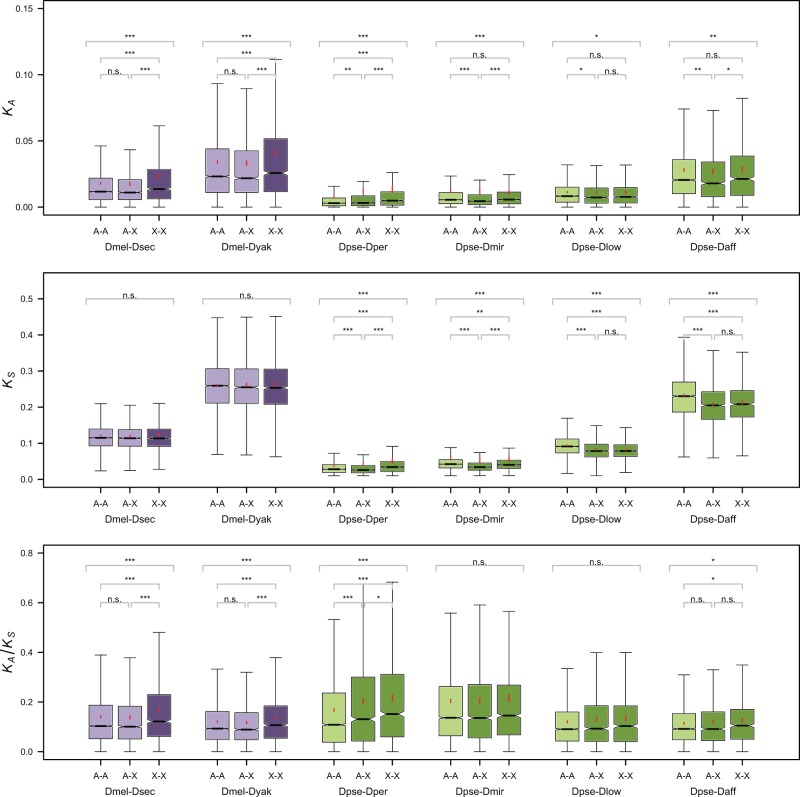
Fig. 2.—
Notched boxplots of KA (upper panel), KS (middle panel), and KA/KS (lower panel) for six pairs of species analyzed and the three categories of genes (AA, XX, and AX). The boundary of the box closest to zero indicates the 25th percentile and that farthest from zero the 75th percentile. The whiskers indicate 1.5 times the interquartile range. A line within a box marks the median and the notches represent 95% CIs for the medians. A red point marks the mean and the red lines the 95% CIs for the mean (which are usually too narrow to be visible). Outliers not shown. Stars above the boxplot indicate statistical significance levels (***P < 0.001, **P < 0.01, *P < 0.05, and ns, not significant). Stars above all three boxplots for a species pair indicate significant heterogeneity among chromosome types (determined through a Kruskal–Wallis test). For species with heterogeneity among chromosome types, the significance of pairwise comparisons between A–A, A–X, and X–X loci is shown (determined with a Mann–Whitney U test).

