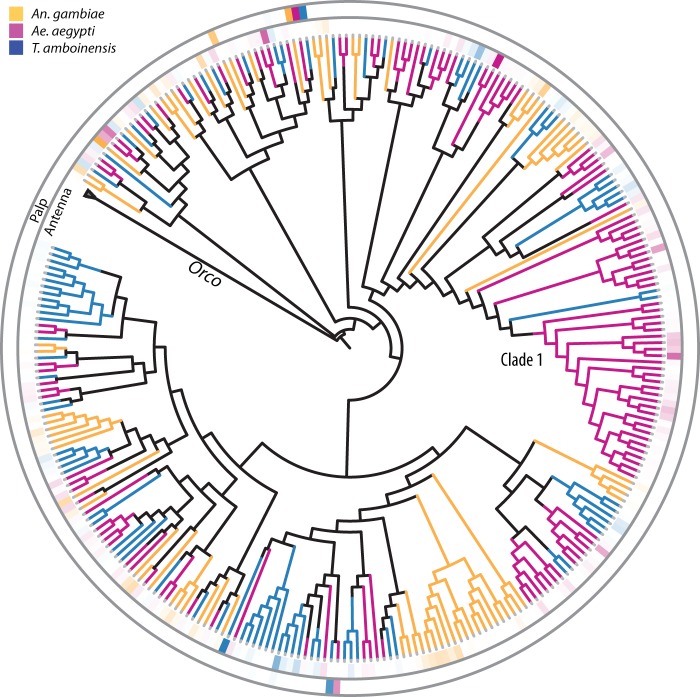
Fig. 3.—
OR gene tree and their relative expression in the antennae and palp of T. amboinensis, Ae. aegypti, and An. gambiae. Gene phylogeny of the OR-family of chemoreceptors. Branches are color coded by the respective species and the heat maps at the branch tips represent the RPKM-percent composition of each family member within the entirety of that family’s expression within the tissue of each species. The outer heat map ring displays the tissue expression profile in maxillary palps and the inner heat map ring displays the tissue expression profile in antennae. Orco was used to root the tree and the Orco clade was collapsed to emphasize differences between the tuning ORs.

