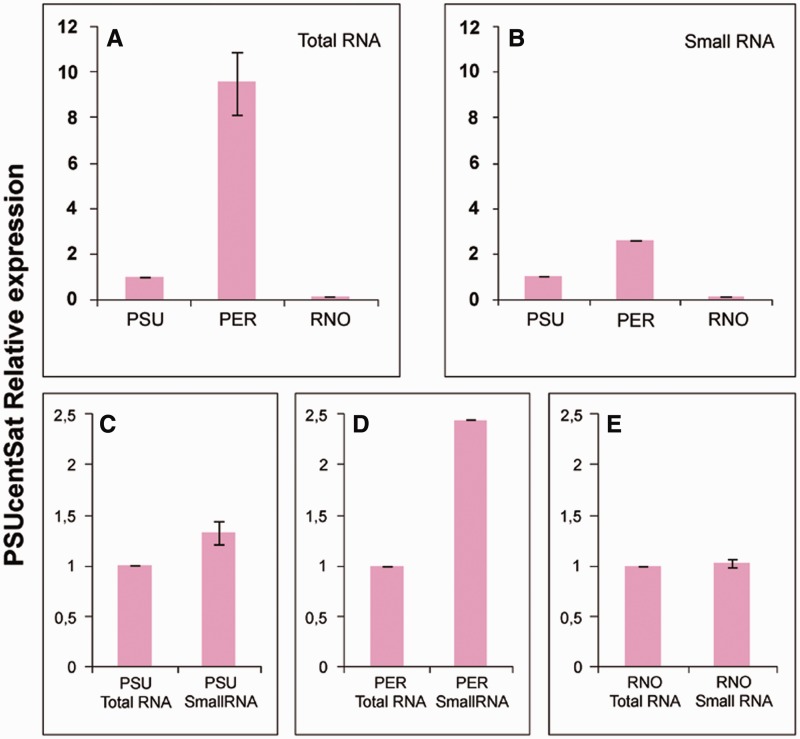
Fig. 5.—
Relative expression analysis of PSUcentSat in fibroblast cells of PSU, PER, and RNO. (A) Relative expression analysis of PSUcentSat in total RNA from fibroblast cells of PSU, PER, and RNO. (B) Relative expression analysis of PSUcentSat in small RNA from fibroblast cells of PSU, PER, and RNO. Expression results were obtained by RT-qPCR, normalized with the expression of the reference gene GAPDH and the PSUcentSat expression in PER and RNO genomes compared with the expression in PSU genome (control). (C) Relative expression analysis of PSUcentSat in total and small RNA from a fibroblast cells of PSU, (D) PER, (E) and RNO. Expression results were obtained by RT-qPCR, normalized with the expression of GAPDH gene and PSUcentSat expression in small RNA compared with the expression in the total RNA (control). Data are presented as mean corresponding to fold change relative to the control sample (P < 0.05). Error bars represent ± SD.

