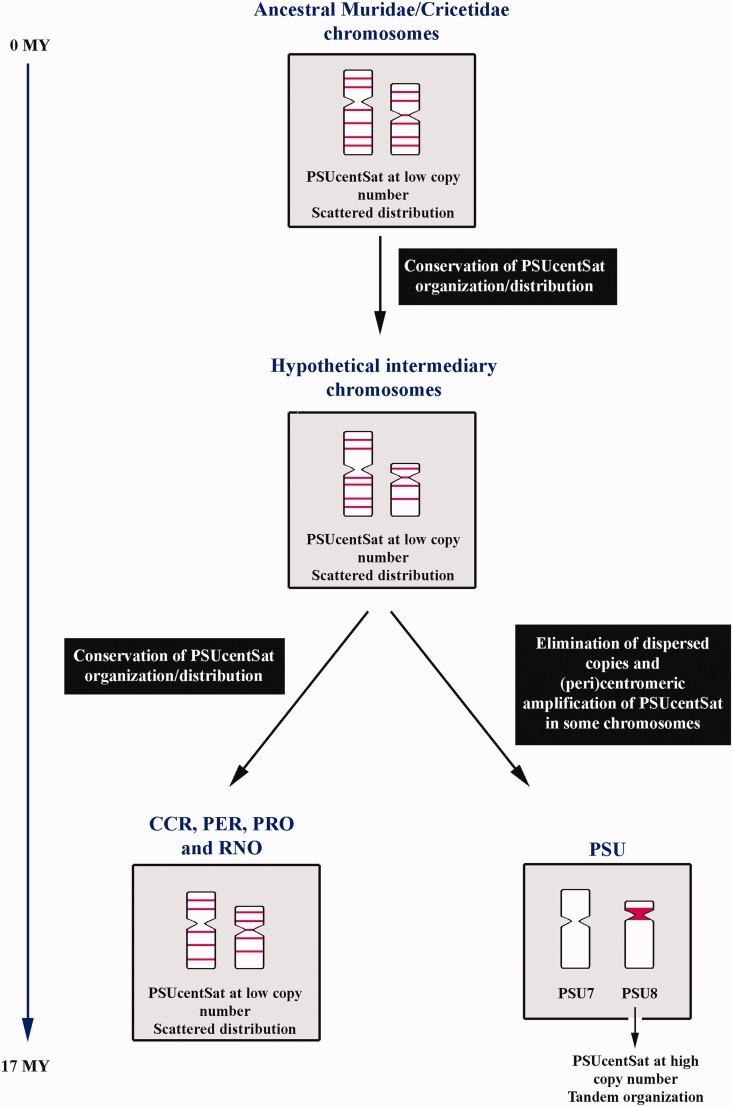
Fig. 6.—
Hypothetical model explaining the evolution of PSUcentSat. In this figure is schematized the most parsimonious evolutionary pathway for PSUcentSat during the evolution of the studied genomes, CCR, PER, PRO, PSU, and RNO in two chromosomes, as example. Red blocks correspond to PSUcentSat location. Time estimates are according to Robinson et al. (1997).

