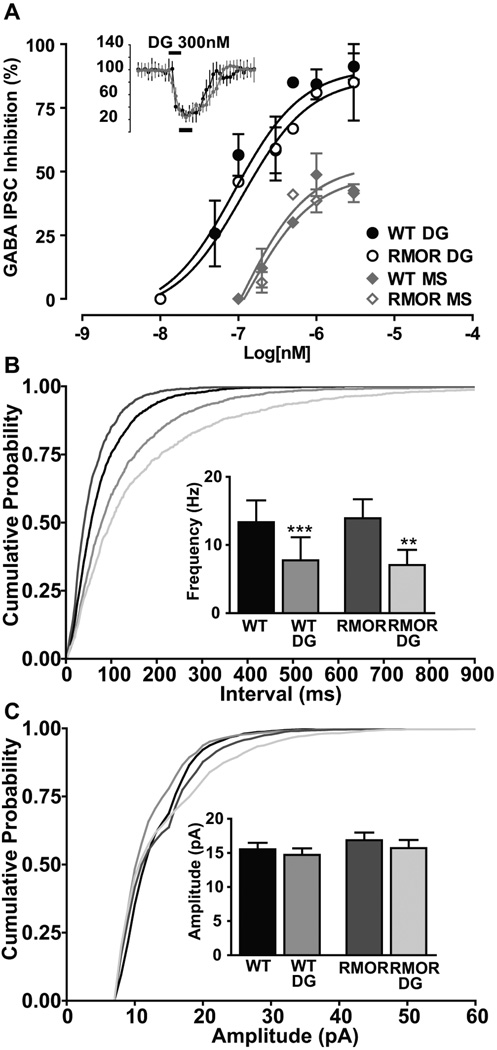
Figure 2. MOR and RMOR in the VTA show equivalent acute responses to opioid agonist.
A. DAMGO (DG) and morphine (MS for morphine sulfate) dose–response curves of peak inhibition (black bars, 3 min window, inset) of GABA IPSCs plotted against log10 (agonist in nanomolar). Sigmoidal dose–response curves fitted for WT and RMOR were not significantly different for DAMGO (WT EC50 of 89.22 ± 0.28 nm, E max of 90.57 ± 7.6; RMOR EC50 of 112.6 ± 0.32 nm, E max of 86.96 ± 10.6; n = 17 each) or morphine (WT EC50 of 106.2 ± 0.78 nm, E max of 52.82 ± 9.8; RMOR EC50 of 125.7 ± 0.51 nm, E max of 48.66 ± 6.52; n = 8 each). B. Cumulative inter-event interval distribution showing equivalent presynaptic inhibition of GABA frequency by 300 nm DAMGO (DG) in WT and RMOR mice. B. Inset, DAMGO significantly inhibits GABA mIPSC frequency in WT (n = 9) and RMOR (n = 9). C. Cumulative amplitude distribution of GABA mIPSCs shows no effect of DAMGO in either WT or RMOR. C. Inset, DAMGO does not inhibit GABA mIPSC amplitude in WT (n = 9) or RMOR (n = 9). The distributions of frequencies were not significantly different comparing WT and RMOR in either the absence (n = 9) or presence of DAMGO (n = 9). Reproduced from (Madhavan et al., 2009).

