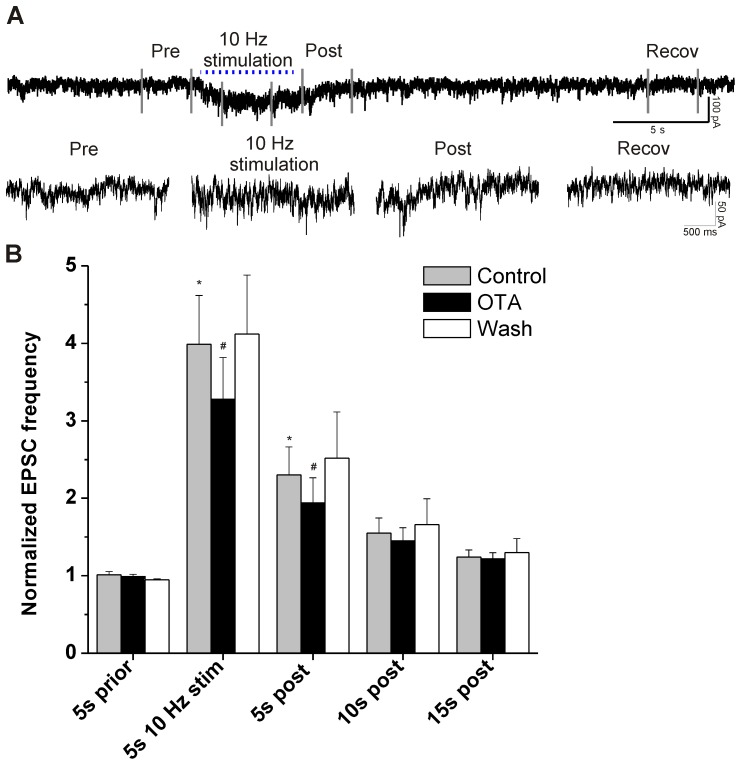
Figure 3. EPSCs during and after train stimulation.
A, Upper trace: original recording with a 5 s train of stimuli (10 Hz,). Lower traces are details of Pre, 10 Hz Stimulation, Post and Recovery conditions of same recording. B, Group data of EPSCs. EPSC are increased during stimulation until at least 5 s post stimulation (* p<0.05 compared to Control 5 s prior). Oxytocin antagonist OTA reduces the EPSC frequency during and 5 s post stimulation (#, 5 s 10 Hz stim Control vs. OTA, p = 0.015; 5 s post Control vs OTA, p = 0.012).

