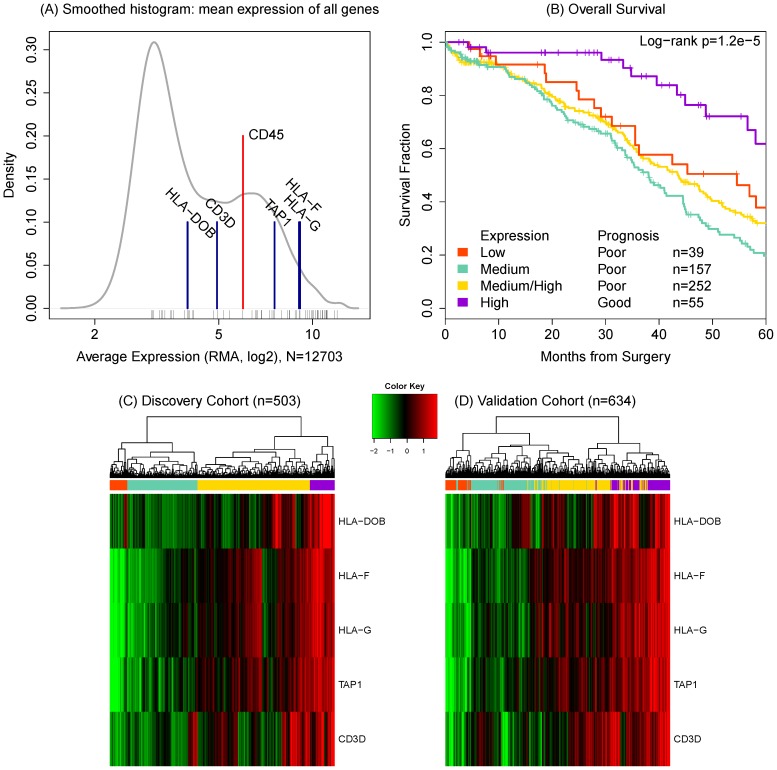
Figure 1. Mean relative expression of the selected genes confirms that they are all expressed in the samples (A).
Black ticks indicate the mean expression of immune-related genes. CD45 is highlighted as a lymphocyte specific marker indicating the presence of lymphocytes. Subgroup-based survival estimates (B) are shown for the TCGA data based on hierarchical clustering of relative expression of selected T-cell genes (C and D). The four color bar on the left identifies the subgroups. The purple subset (n = 55, 11%) represents a significant survival benefit associated with the expression of all five genes.

