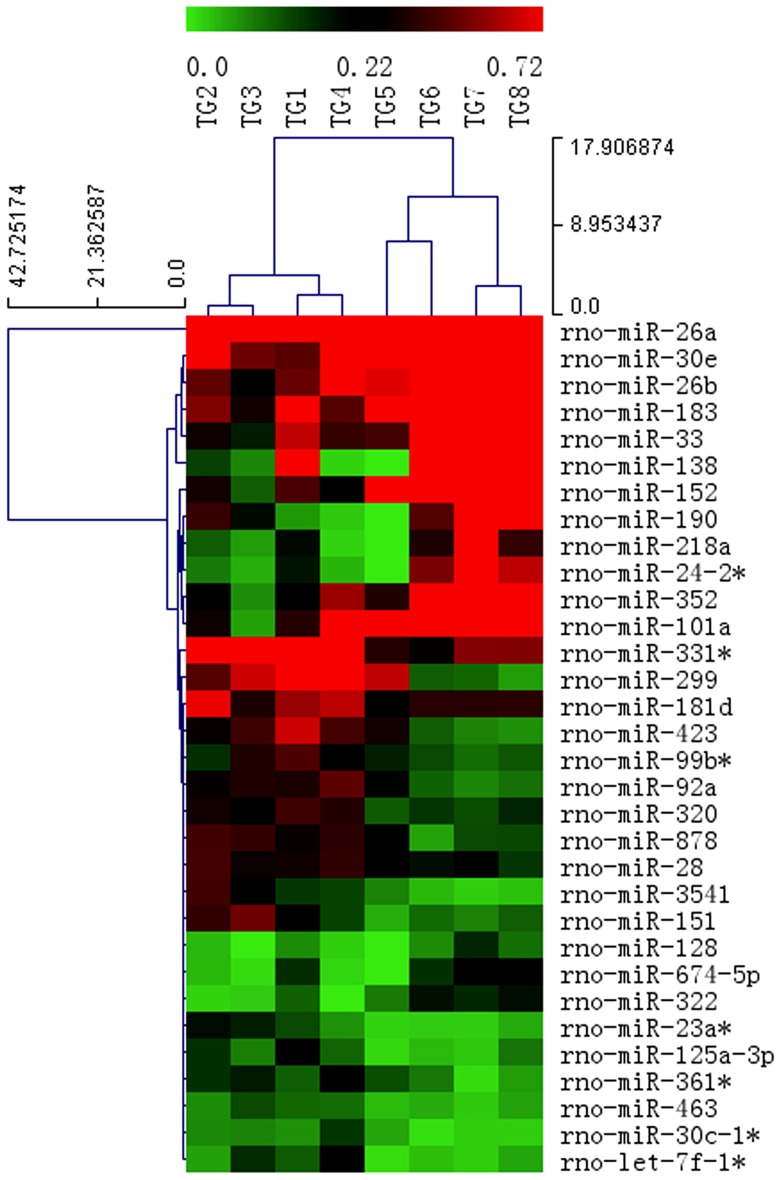
Figure 1. Hierarchical cluster analysis of differentially expressed miRNAs in injection-ipsilateral TGs.
TG1, TG2, TG3 and TG4 were from rats with facial normal saline injection, whereas TG5, TG6, TG7 and TG8 were from rats with facial CFA injection (n = 4/group). Each row represents a miRNA, and each column represents a TG sample. Red represents high expression, and green represents low expression (fold change >1.5).

