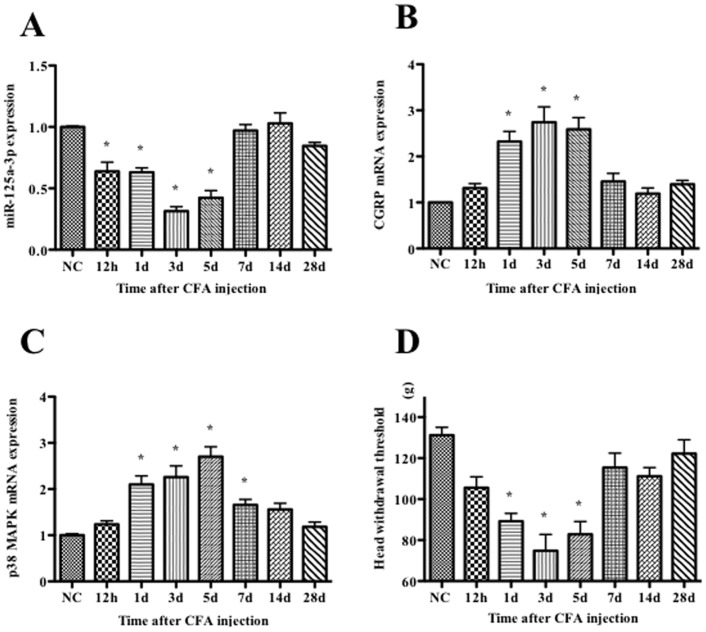
Figure 3. Expression of miR-125a-3p (A), CGRP (B) and p38 MAPK (C) mRNA in ipsilateral TGs and head withdrawal thresholds (D) in ipsilateral orofacial region at different time points following CFA injection into rat orofacial skin.
The results are shown as a percentage compared with the NC (normal control, baseline before injection). Values are the means ± SD (n = 5/time point). * p<0.01.

