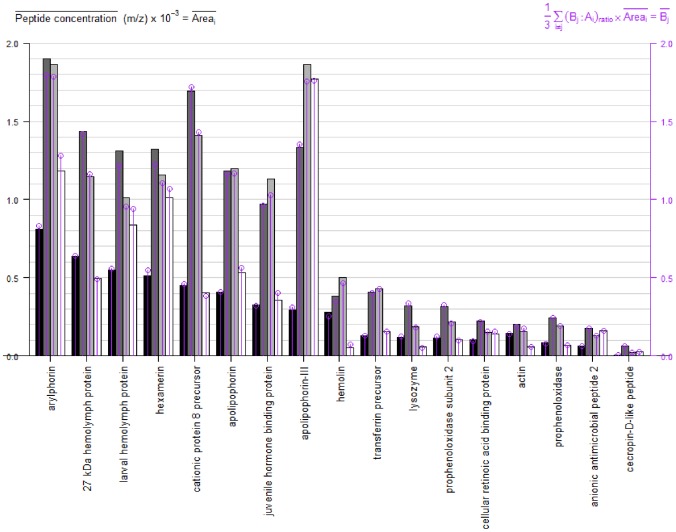
Figure 3. Results of protein expression of 17 proteins.
The plot represents a comparative data expression level of the quantitative peptide concentration from 0 to 2000 units from the selected main results of 17 proteins identified by iTRAQ using ProteinPilot. Black bars correspond to 104 microconidia/mL at 25°C, dark gray bars correspond to 106 microconidia/mL at 37°C, light gray bars correspond to 104 microconidia/mL at 37°C and white bars correspond to controls at 25°C untreated. Left y-axis axis is the average of the sum of the peptide areas, m/z (Area), as represented in black, gray and white bars. Right y-axis (purple lines) represent the average of the sum of the iTRAQ ratios per the mean of the sum from the peptide areas, m/z or Vp.

