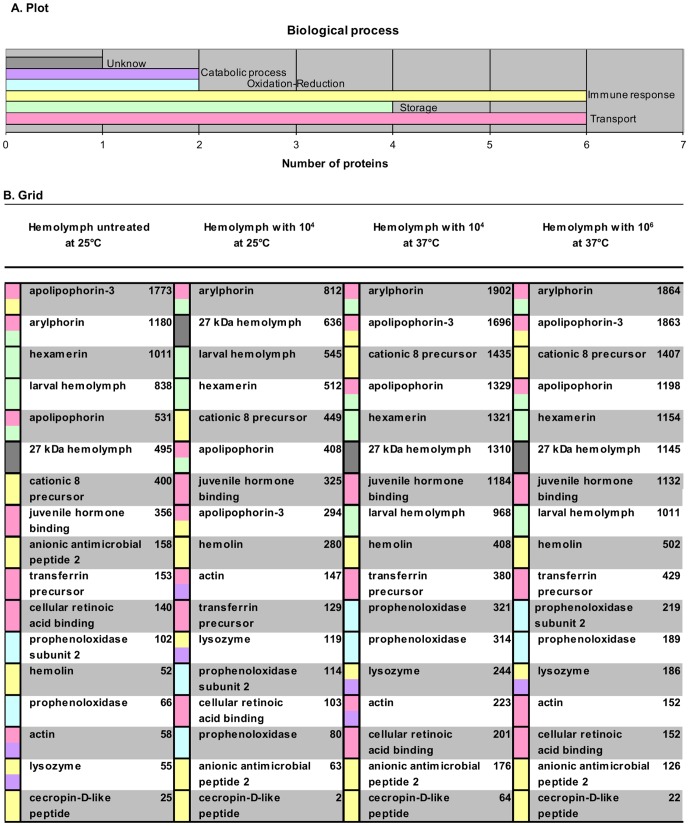
Figure 4. Biological process from 17 proteins.
Colors in graph A and table B are related. A. Plot shows the number of proteins reported in databases in relationship with immune response. B. Grid represents either controls or microconidia concentrations in each treatment column (microconidia/mL). Column at the left of the protein name provides the color of the biological function. Some proteins have two or more functions, but for immune activity we selected two, including immune response. The column at the right of the protein name shows the concentration level of peptides. Gray represents an unknown function, but the protein domains were identified as follows: purple, catabolic process; blue, oxidation-reduction; yellow, immune response; green, storage; and red, transport.

