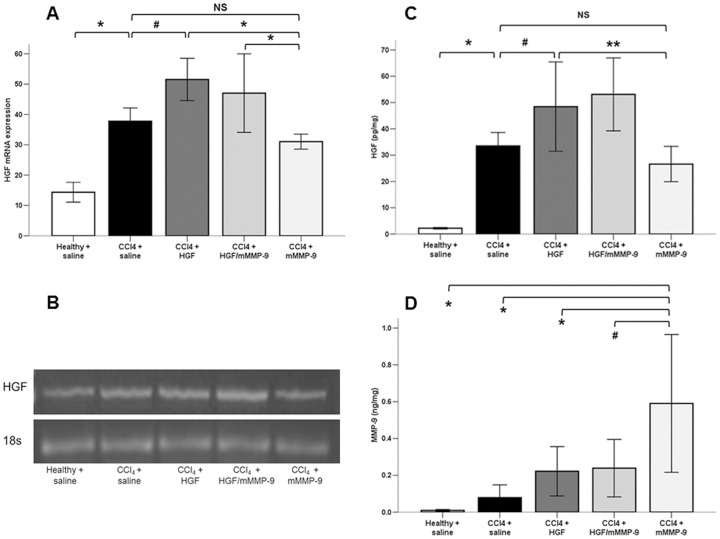
Figure 1. Analysis of HGF and MMP-9 gene expression.
(A, B) RT-PCR gel of HGF mRNA expression. HGF mRNA expression was significantly (*, p<0.001) elevated in the saline-treated fibrotic (n = 14) compared to saline-treated healthy livers (n = 10) and further elevated (#, p<0.01) in the HGF-treated fibrotic (n = 13) compared with the saline-treated fibrotic and mMM-9-treated fibrotic (n = 10) livers (*, p<0.01). (C) Analysis of HGF protein concentration in the liver tissues. HGF protein concentration was significantly (*, p<0.001) elevated in the liver of the saline-treated fibrotic livers (n = 11) compared to saline-treated healthy livers (n = 10) and more elevated in the HGF-treated fibrotic (n = 14) compared to the saline-treated fibrotic (#, p<0.05) and mMMP-9-treated fibrotic (n = 10) livers (**, p<0.01). (D) Analysis of MMP-9 protein concentration in the liver tissues. MMP-9 protein concentration was significantly elevated in the mMMP-9-treated (n = 10) compared with healthy (n = 9), saline-treated fibrotic (n = 13) livers, HGF-treated (n = 12) livers (*, p<0.01) and HGF/mMMP-9-treated (n = 6) livers (#, p<0.05).

