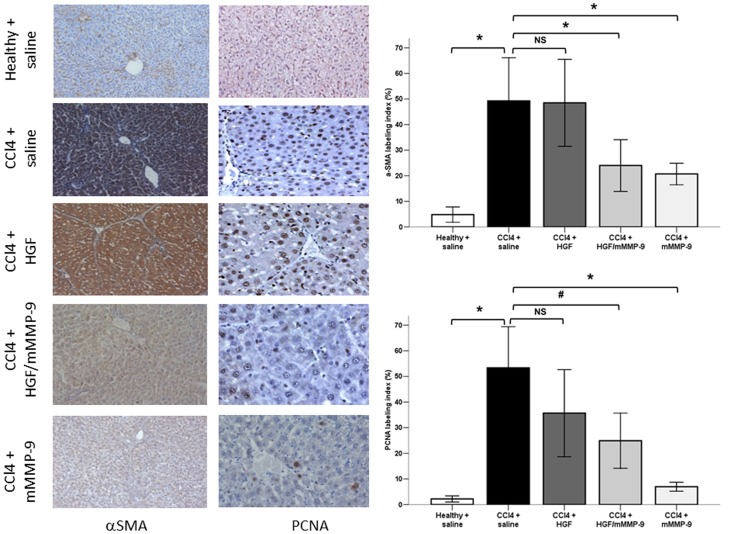
Figure 4. Immunohistochemical staining for α-SMA and PCNA in the liver.
Bar graphs represent α-SMA and PCNA labeling indices (percent of positively stained brown cytoplasm or brown nuclei, respectively in 10 successive fields). Both α-SMA and PCNA indices were significantly elevated (*, p<0.001) in saline-treated fibrotic (n = 14 both) compared with healthy livers (n = 10 both) and both were significantly reduced (*, p<0.001) in mMMP-9-treated (n = 10 both) and in HGF/mMMP-9-treated (n = 9 both, *, p<0.001 and #, p<0.01, respectively) versus saline-treated fibrotic livers. Both α-SMA and PCNA labeling indices were not significantly different in HGF-treated fibrotic (n = 14, p = 0.99 and p = 0.06, respectively) from that in saline-treated fibrotic livers. (Original magnification ×400).

