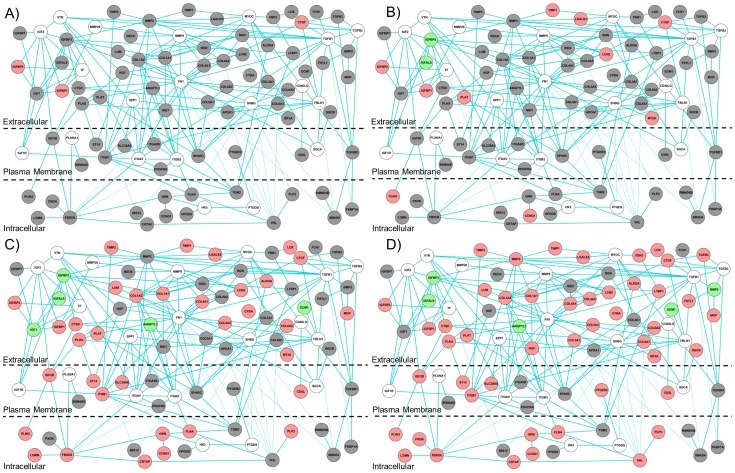
Figure 7. Activation of genes encoding proteins in liver fibrosis-relevant network module M5 at different time points.
Genes encoding proteins with average log2 fold-change ratios>0.6 are colored in red. Genes encoding proteins with average log2 fold-change ratios <−0.6 are colored in green. Genes encoding proteins with average log2fold-change ratios between 0.6 and −0.6<−0.6 are colored in grey. A) Activation at 0.25-day exposure. The mapped expression profile is the average log2 ratio in 1-naphthyl isothiocyanate 30 mg/kg and 60 mg/kg, at 0.25-day exposure. B) Activation at 1 day of exposure. The mapped expression profile is the average log2 ratio in 1-naphthyl isothiocyanate 30 mg/kg and 60 mg/kg, and 4,4'-Methylenedianiline 81 mg/kg, at 1 day of exposure. C) Activation at 3 days of exposure. The mapped expression profile is the average log2 ratio in 1-naphthyl isothiocyanate 30 mg/kg and 60 mg/kg, and 4,4'-Methylenedianiline 81 mg/kg, at 3 days of exposure. D) Activation at >3 days of exposure. The mapped expression profile is the average log2 ratio across chemical exposures that produced liver fibrosis.

