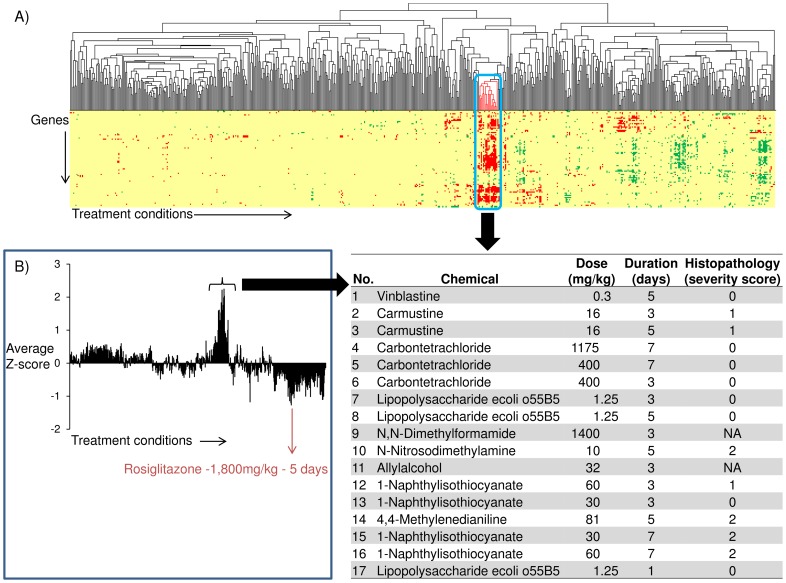
Figure 8. Analysis of genes in liver fibrosis-relevant network module M5.
A) Hierarchical clustering of 640 chemical exposures using genes in liver fibrosis-relevant network module M5. The conditions that clustered with four liver fibrosis-producing conditions are highlighted and listed. Genes with Z-scores>2 are colored in red. Genes with Z-scores <−2 are colored in green. Genes with Z-scores between 2 and -2 are colored in yellow. NA in the table represents that histopathological data was not available for that chemical exposure condition. B) Average Z-scores across the genes in module M5 for each of the 640 chemical exposure conditions.

