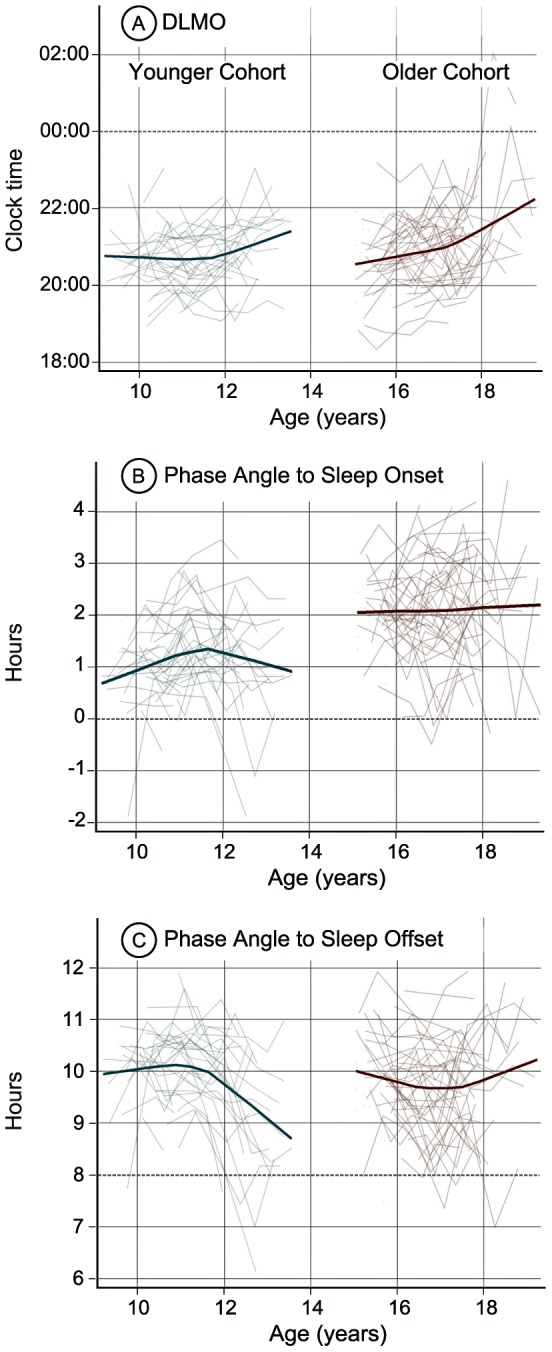
Figure 2. Modeled developmental trajectories (bold line) and individual trajectories (thin lines) for DLMO phase (A), DLMO phase angle to sleep onset (B), and DLMO phase angle to sleep offset (C).

A negative DLMO phase angle to sleep onset indicates when the DLMO occurred after weekday sleep onset.
