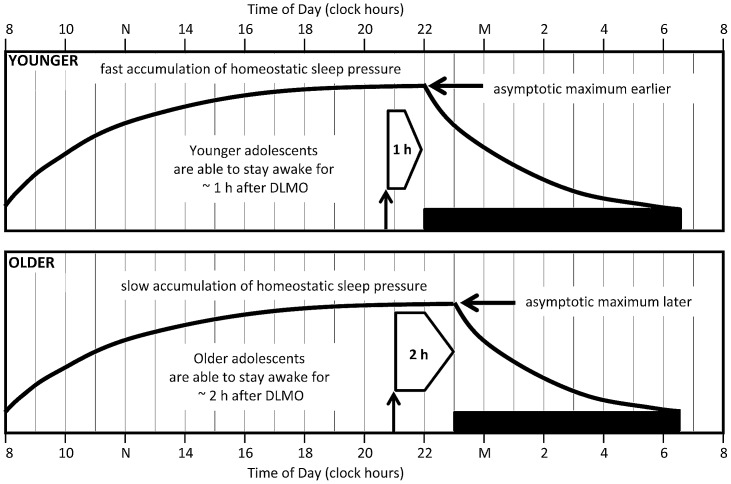
Figure 3. A proposed model to explain phase angle to sleep onset differences in the younger (top) and older (bottom) adolescent cohorts.
Black horizontal bars illustrate average sleep times for each cohort (younger: 21:55–06:35; older: 23:02–06:40). Bold lines illustrate sleep pressure accumulation and dissipation functions predicted by the homeostatic sleep system. The upward facing arrow indicates the average DLMO phase for each age group (younger: 20:42; older: 20:54), and the right-facing block arrow shows the interval between DLMO phase and sleep onset (phase angle to sleep onset). Based on previous modeling work, [27] the saturating exponential function reaches it maximum more quickly and therefore at an earlier clock time in the younger cohort compared to the older cohort. We propose that the older adolescents are able to stay awake for a longer period of time (∼2 h) after DLMO phase compared to the younger adolescents (∼1 h) because of this developmental difference in homeostatic sleep pressure at the end of the waking day.

