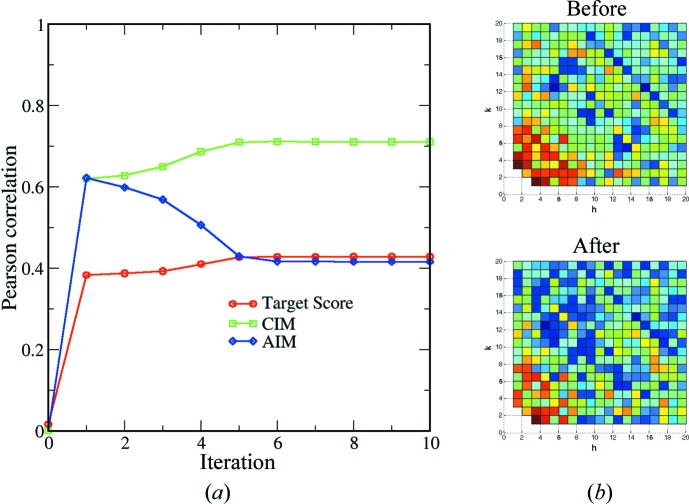
Figure 2.
Test results of the detwinning algorithm with an experimental data set collected at LCLS for photosystem I. (a) The detwinning process. The reference intensity is the theoretical value calculated from the PDB model (pdb code 1jb0). The blue and green curves are the correlation coefficients between the theoretical and merged intensities at two indexing modes. The red curve is the target score, i.e. the average of the highest correlation coefficients between each pattern and the merged model. (b) The intensity distribution within the first quadrant in the plane of l = 0 in reciprocal space. The symmetry of the twinned data (top) disappears after applying the EM detwinning algorithm (bottom).

