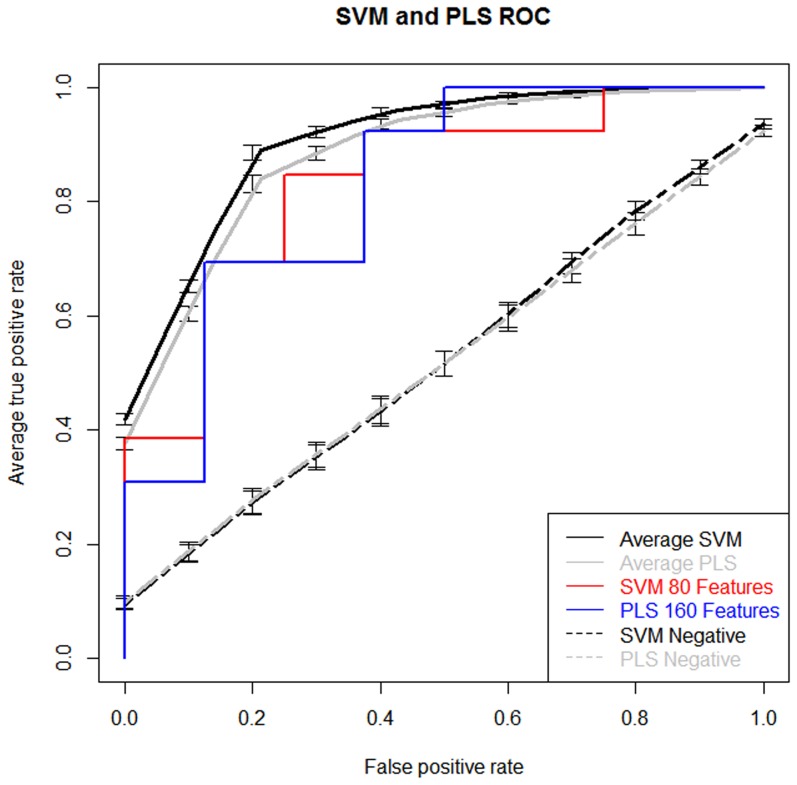
Figure 4. ROC curve performance of the classification models from the training and validation sets.
The average of 100 iterations of the classifier for the best performing feature sets following recursive feature elimination comparing ASD vs. TD samples (Black and Grey Lines). The blue (PLS) and red (SVM) lines are ROC curves of the best performing validation feature subsets. Vertical bars represent the standard error of the mean.

