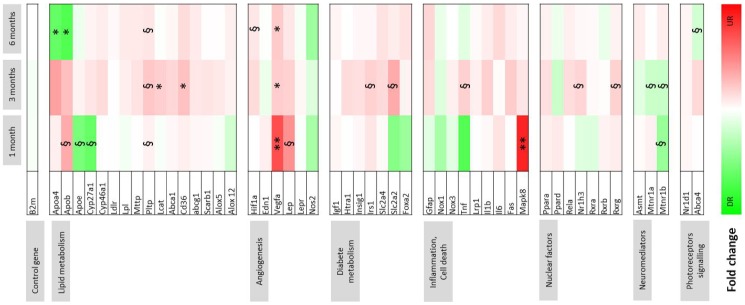
Figure 7. Gene expression changes in the neurosensory retina induced by a 60%-rich fructose diet in the rat.
Data of gene expression were obtained by RT-qPCR and represented as a heat map. Fold change is indicated in the color scale, green indicates downregulation (up to 10-fold repression) and red indicates upregulation (up to 7-fold induction) in the retina of rats fed with the 60%-rich fructose diet by comparison to the rats fed with the standard diet at the corresponding ages (n = 8 per group). §, * and **, statistically different at p≤0.1, 0.05 and 0.01, respectively (Student t-test, n = 8 per group).

