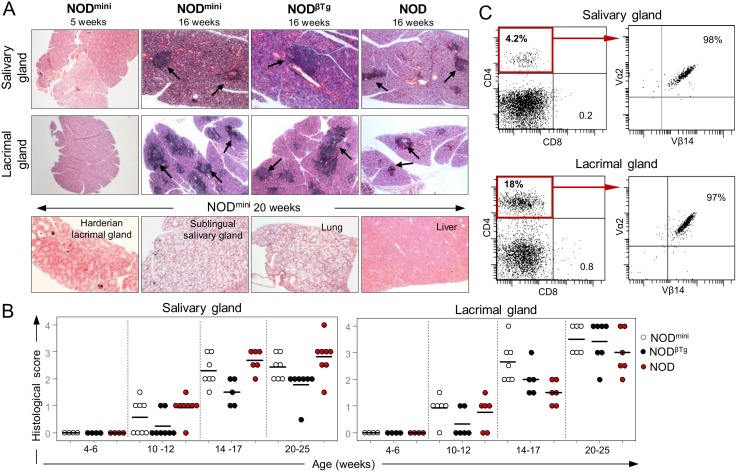
Figure 4. Lymphocytic infiltrates in mandibular salivary and extraorbital lacrimal glands.
(A) H&E staining of tissue sections from indicated organs of analyzed mice, showing lymphocytic infiltrates indicated by arrows. (B) Histological score of infiltrated glands in indicated age groups. Scoring criteria: score 0, no infiltrates; score 1–1.5, 1–2 foci per section; 2–2.5, 3–5 foci per section; score 3, 6–10 foci per section; score 4, more than 10 foci per section. Infiltrate is considered as focus when number of infiltrating cells in continuous space is greater than 50. Three sections at different anatomical locations per organ were analyzed with at least 5 mice per age group. (C) FACS analysis of CD4 T cells infiltrating into salivary and lacrimal glands in 16 week old NODmini mice. Dot plots on the right show expression of transgenic TCR on CD4+ gated cells.

