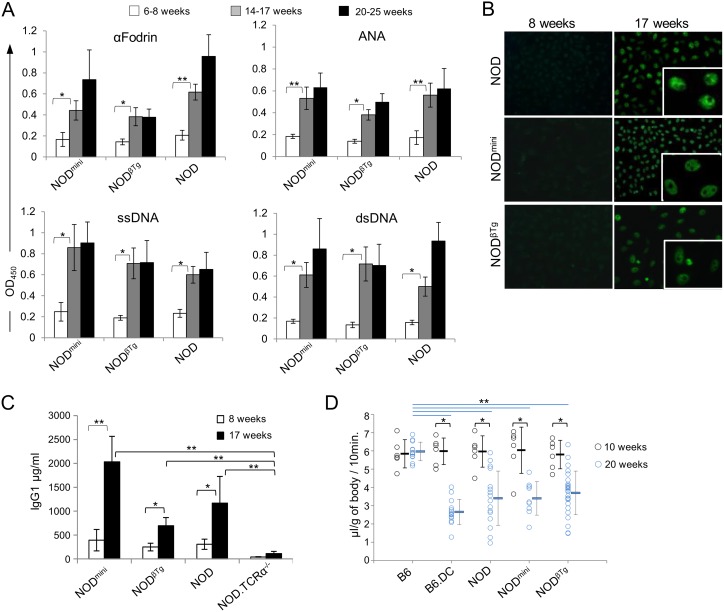
Figure 5. Detection of autoantibodies and hyposalivation in NODmini and NODβTg mice.
(A) ELISA assay was performed using mouse serum (1∶100) from indicated age groups. Each graph represents mean value of OD450 and standard deviation for indicated antigens. At least six mice were used per each group. *p<0.05, **p<0.005. (B) Detection of ANAs pattern using Hep-2 cell line. Sera from mice were diluted 1∶40, incubated with HEp-2-fixed slides and evaluated under fluorescent microscope at x20 magnifications. Representative images are shown. (C) Quantitative ELISA analysis of IgG1 levels in sera (1∶50,000) from indicated mice. Each bar represents mean value and standard deviation from six mice per experimental groups. (D) Salivary flow rates after pilocarpine injection in indicated mice at 10 and 20 wks of age. Double congenic B6.NODIdd3.NODIdd5 (B6.DC) mice, that develop SS on B6 genetic background, were used as a control. Saliva volume was measured and calculated in mg per mouse body mass. Each circle represents one mouse and horizontal lines indicate mean values of the experimental groups. T-test was used to calculate differences between groups. *p<0.002, **p<0.0002.

