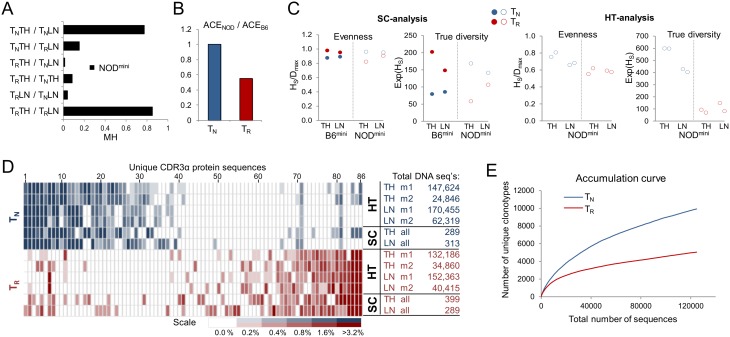
Figure 6. TCR repertoire of naïve and regulatory T cells in NODmini mice.
(A) Similarity between indicated populations (first 289 single cell sequences per each population) was estimated based on Morisita-Horn index (MH). TN - naïve CD4+Foxp3−CD45RB+CD62L+ T cells, TR - regulatory CD4+Foxp3+ T cells, TH - thymus, LN - lymph nodes. (B) Ratio of richness of TCRs on TN and TR cells between NODmini and B6mini mice. Abundance coverage estimator (ACE) was calculated based on 578 sequences for each population combined from thymus and peripheral lymph nodes. (C) Evenness and effective number of species (ENS) for analyzed TCR repertoires. Shannon evenness index was calculated as Shannon entropy (Hs) divided by maximum diversity Dmax, where Dmax equals natural logarithm of number of unique sequences in analyzed population. ENS (true diversity) was calculated as exponential of Shannon entropy. (D) Comparison of frequency of 20 most dominant unique protein CDR3 clonotypes found in each population indicated on the right of the heat map. Table indicates analyzed populations from lymph nodes and thymii by single cell analysis (SC) and high throughput sequencing (HT). Experimental mouse 1 and 2 are marked as m1 and m2. Numbers next to each population indicate total numbers of DNA sequences analyzed. All 86 unique CDR3α protein sequences in the heat map are shown in Table S1. (E) Accumulation curve of unique DNA clonotypes observed after accumulation of 124,730 sequences for TN cells and 124,696 for TR cells. (A–C) All indices were computed based on DNA sequences for each population using software SPADE and EstimateS8.2.

