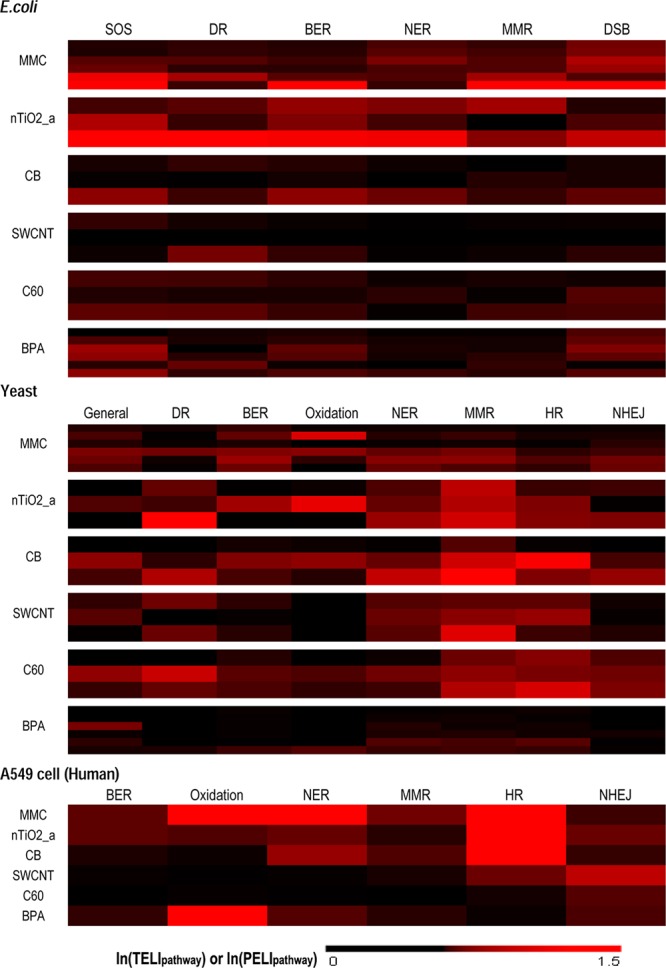
Figure 3.

DNA damage repair pathway responses profiles reveal distinct potential DNA damage mechanisms among different ENMs. The mean natural log value of TELIpathway or PELIpathway indicates the magnitude of pathway responses (represented by a black–red color scale at bottom. Values over 1.5 are shown as 1.5). MMC: mitomycin C; CB: carbon black; SWCNT: single wall carbon nanotube; C60: purified fullerene; BPA: bisphenol A. X-axis top: pathways of DNA damage repair (see Table 1 for details). Y-axis left: chemical/ENM and concentration(s) from lowest to highest from top to bottom (see concentrations in SI Table S1).
