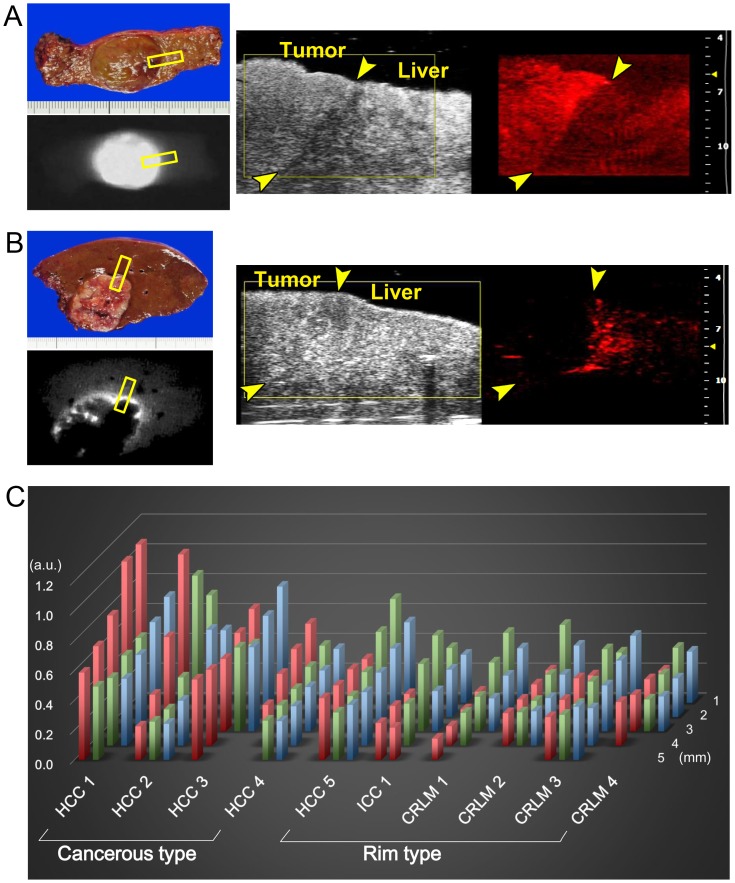
Figure 2. Photoacoustic tomography of surgically-resected hepatic tissue in humans.
(A) Fluorescence imaging identified uniform fluorescence of ICG on the cut surface of well-differentiated HCC tissue (left). PA tomography from the cut surface of the specimen visualized accumulation of ICG in cancerous tissues on US images (right, please see video S1). (B) Fluorescence imaging identified rim-type ICG fluorescence around CRLM lesions on the cut surface of the resected specimen (left). Photoacoustic tomography from the cut surface visualized accumulation of ICG in the peri-cancerous hepatic tissue on US images (right, please see video S2). Yellow squares and arrows in A and B indicate the site where a probe of the imaging system was attached and the boundaries between the tumors and non-cancerous liver parenchyma, respectively. (C) Photoacoustic amplitude of each ROI from the resected specimen (red bar indicates cancerous region; green bar, peri-cancerous region; and blue bar, non-cancerous hepatic parenchyma 2 mm from the tumor) according to the depth of the ROI from the sample's surface (depths of 1 to 5 mm). Indocyanine green accumulation was observed in the cancerous tissue in HCC specimens 1–4 (cancerous-type accumulation), while rim-type ICG accumulation was observed in HCC specimen 5, the ICC specimen, and CRLM specimens 1–4.

