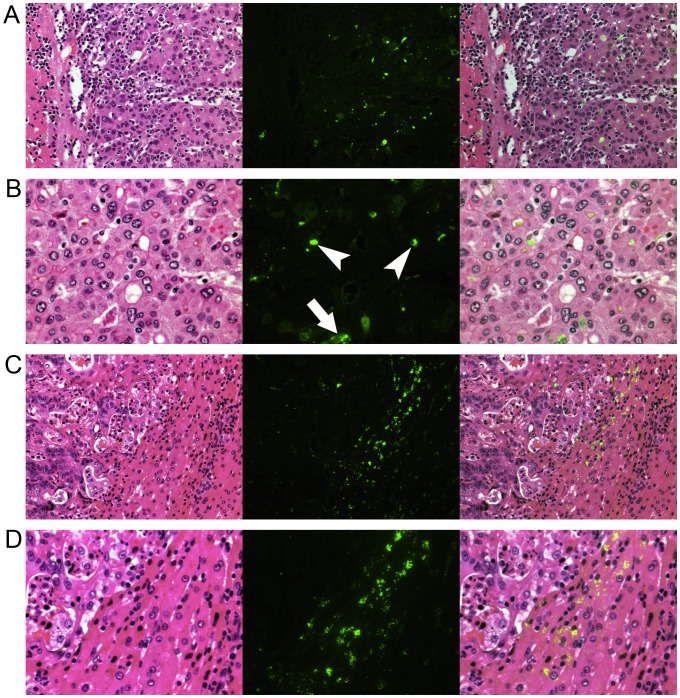
Figure 3. Fluorescence microscopy.
Left, hematoxylin-eosin staining; middle, fluorescence images; and right, fusion images of ICG fluorescence, indicated in green, and hematoxylin-eosin staining. (A) In well-differentiated HC lesions, ICG fluorescence was identified mainly in the cancerous tissue, as demonstrated in Figure 2A. (B) Magnified view of (A). Indocyanine green had accumulated in the pseudoglands (arrowheads) and the cytoplasm of cancer cells (arrow). (C) Indocyanine green fluorescence was identified in the peri-cancerous hepatic parenchyma surrounding a CRLM lesion, as demonstrated in Figure 2B. (D) Magnified view of (C). Indocyanine green had accumulated in the cytoplasm of relatively small hepatocytes rather than in the intracellular spaces.

